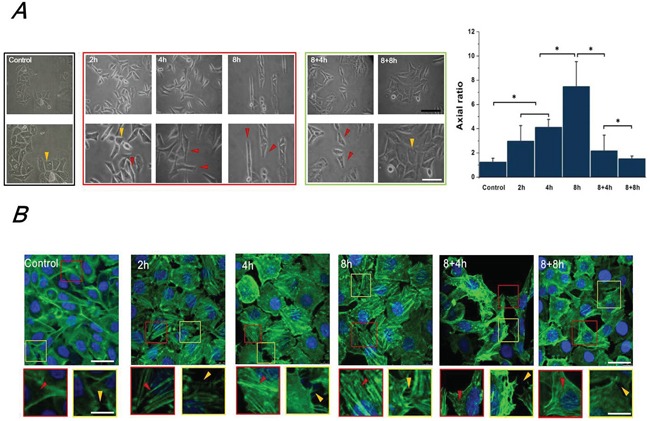
Figure 1. FSS induced the morphology and F-actin changes of Hep2 cells.

A. The morphology of Hep-2 cells exposed to 1.4 dyn/cm2 FSS at different durations and observed under 100×(upper) and 200× (lower) magnification using the inverted microscope. The yellow and red marks in Figure 1A indicated the morphology of cloned cells presented polygon and spindle, respectively. The axial ratio of Hep-2 cells was statistically analyzed by Image J. The black and white scale bars in figures are 50 μm and 20 μm, respectively. B. Effects of FSS on distribution of F-actin arrays in Hep-2. Confocal immunofluorescence images showed localization of F-actin expose to FSS at 2h, 4h, 8h, in response to removing FSS at 4h and 8h, respectively. (green: F-actin; blue: nucleus, scale bar=20 μm). Designated regions indicated by red/yellow square frames and triangular marks in figures are enlarged to show the detailed fiber structure in the cell body and filopodia/lamellipodia at the edge of cell protrusions (scale bar=5 μm).
