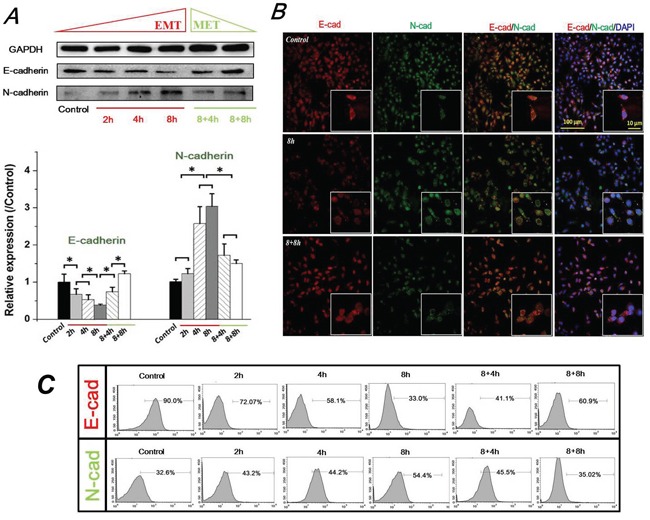
Figure 2. FSS induced expression and distribution of E-cad and N-cad in Hep-2 cells.

A. FSS induced expression of E-cad and N-cad. FSS inducing loss of E-cad led to an EMT process, and a reversible MET occur when FSS was removed. The expression levels of E-cad and N-cad were quantified by image analysis of the Western blot bands. Data are means ± SD from three independent experiments. *, means statistically significant difference with P<0.05. B. Exposing to FSS induced a changed location of E-cad and N-cad at the boundary of cells. C. The positive expression of E-cad and N-cad by flow cytometer at different duration of exposed and removed FSS.
