
Figure 3. RB1 knockdown reverses TA knockdown-induced cell cycle arrest and E2F target gene repression.
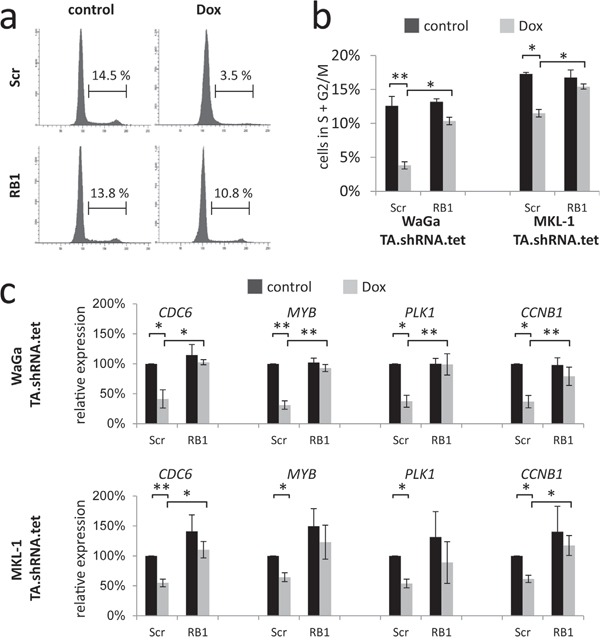
WaGa and MKL-1 cells double infected with inducible TA-shRNA and constitutive Scr- or RB1-shRNA expression constructs were cultured for 5 days in the absence or presence of Dox. a and b. Fixed cells were stained with propidium iodide and DNA content was determined by flow cytometry. a) Examples of cell cycle profiles for WaGa. b) Depiction of the percentage of cells with >2N DNA. Bars represent mean values (+/− SD) of at least 3 independent experiments. c. Relative expression levels of the indicated cell cycle-related RB target genes were determined by real-time PCR and the ΔΔCT method. RPLP0 served as endogenous control for normalization and Scr shRNA-infected cells without Dox treatment were used as calibrator. Mean values (+/− SD) of 3 independent experiments are depicted. Statistical analyses were performed using paired student's t-test. (**p<0.005; *p<0.05).