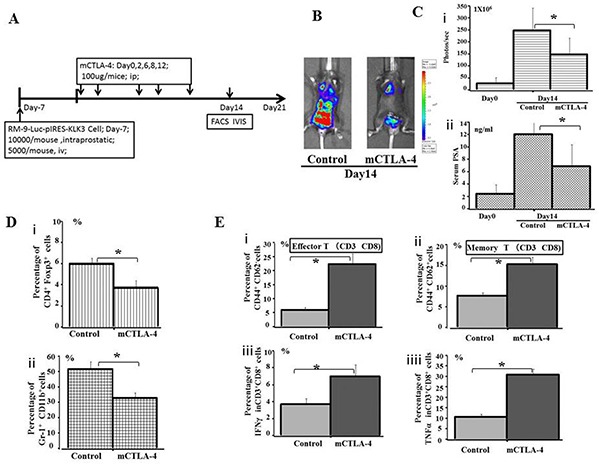
Figure 5. Evaluation of the effect of immunotherapy by immune checkpoint CTLA-4 blockade.

A. The plan for therapeutic effect on mice CTLA-4 blockade. B. Bioluminescence images of mice from each treatment group are shown 14 days after treatment. RM9-Luc-pIRES-KLK3 cells in tumors were imaged after luciferin injection using the IVIS instrument. Left panel shows the control group, whereas the right panel displays the mice CTLA-4 blockade group. C. Tumor volume (i) was determined by region-of-interest analysis of total photons per second. Serum PSA levels (ng/mL) (ii) were determined by ELISA from the groups of CTLA-4 blockade and control. Mean values were analyzed among groups. * CTLA-4 blockade vs. control (p < 0.05). D. The percentage of peripheral CD4+Foxp3+ Treg cells (i) and Gr-1+CD11b+ MDSC cells (ii) among the total number of lymphocytes, as quantified by FACS analysis, are shown for the indicated groups and times. Mean values were analyzed among groups. * CTLA-4 blockade vs. control group (p < 0.05). E. The percentage of peripheral CD44+CD62− Effector T cells (i), CD44+CD62+ Memory T cells (ii), IFN-γ (iii), and TNFα (iv) in population of CD3+CD8+ cells were quantified by FACS analysis and are shown for the indicated groups and times. Mean values were analyzed among groups. *CTLA-4 blockade vs. control group (p < 0.05).
