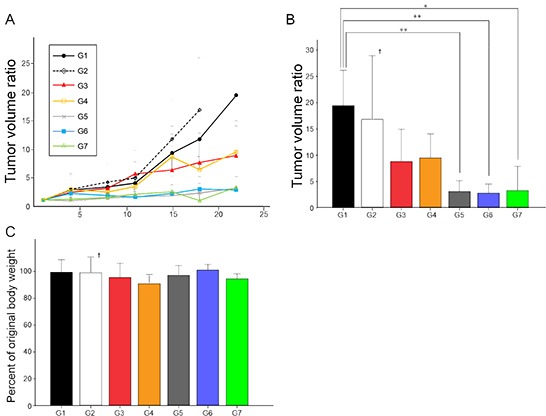
Figure 3. Efficacy of chemotherapy and S. typhimurium A1-R in the FDCS PDOX A, B.

Group 1, control with PBS, i.p.; Group 2, treated with BEZ, 50 mg/kg oral gavage, q5/W for 4 weeks; Group 3, treated with DOX, 2.4 mg/kg, i.p., qW for 4 weeks; Group 4, treated with DOX, 2.4 mg/kg, i.p., qW for 2 weeks; and BEZ, 50 mg/kg, oral gavage, q5/W for 2 weeks; Group 5, treated with S. typhimurium A1-R, 2.5 × 10⁷ CFU, i.p., qW for 4 weeks; Group 6, treated with S. typhimurium A1-R, 2.5 × 10⁷ CFU, i.p., qW for 2 weeks followed by DOX, 2.4 mg/kg, i.p., qW for 2 weeks; and Group 7, treated with S. typhimurium A1-R, 2.5 × 10⁷ CFU, i.p., qW for 2 weeks followed by BEZ, 50 mg/kg, oral gavage, q5/W for 2 weeks. Tumor volume ratio in Group 5 (3.11 ± 2.05, p < 0.01); Group 6 (2.80 ± 1.72, p < 0.01); and Group 7 (3.28 ± 4.62, p < 0.05) were significantly lower than in Group 1 (19.44 ± 6.70). There were not significant differences between any other groups. C. Bar graph shows percentage of original body weight of mice in each group on 22nd day from initial treatment except for Group 2, which was on day-18. Actual weights at these time points were: Group 1: 22.24 ± 1.73; Group 2: 26.13 ± 1.54; Group 3: 22.94 ± 2.01; Group 4: 22.88 ± 1.20; Group 5: 25.32 ± 2.40; Group 6: 25.34 ± 1.52; and Group 7: 23.2 ± 2.21. There were not significant differences between any treated groups and control. *p < 0.05, **p < 0.01. Error bars: ± 1 SD. †The graph of only G2 shows tumor volume ratio on day-18. Error bars: ± 1 SD.
