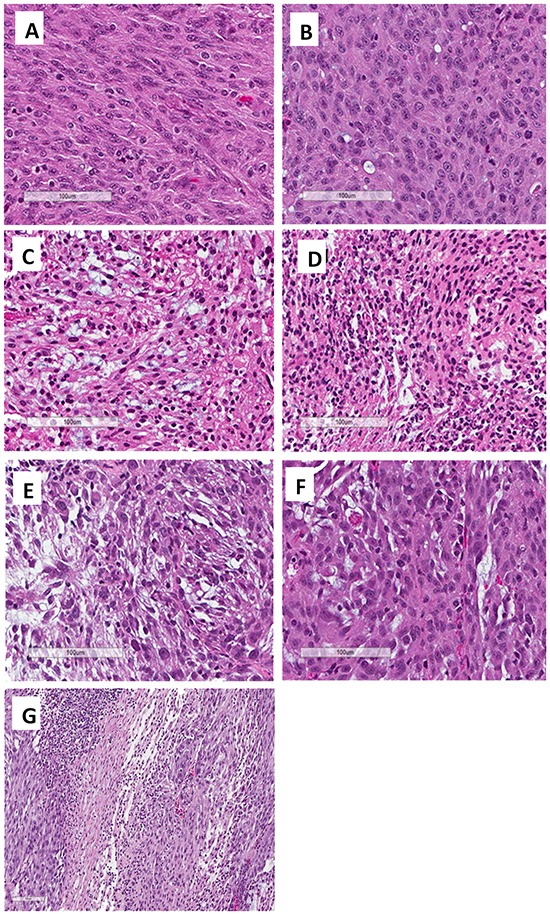
Figure 4. Photomicrographs of H&E-stained slides from the original patient tumor and the PDOX-grown tumor.

A. The patient's original tumor. B. Untreated PDOX tumor. C. Treated tumor with BEZ (Group 2, 5% necrosis). D. Treated tumor with DOX (Group 3, 20% necrosis). E. Treated tumor with S. typhimurium A1-R (Group 5, 50% necrosis). F. Treated tumor with S. typhimurium A1-R and DOX (Group 6, 20% necrosis). G. Treated tumor with S. typhimurium A1-R and BEZ (Group 7, 60% necrosis). Scale bars: 100 μm.
