
Figure 5. DTC-tumor hypoxic profile is partly shared with BALB-neuT tumor metastasis.
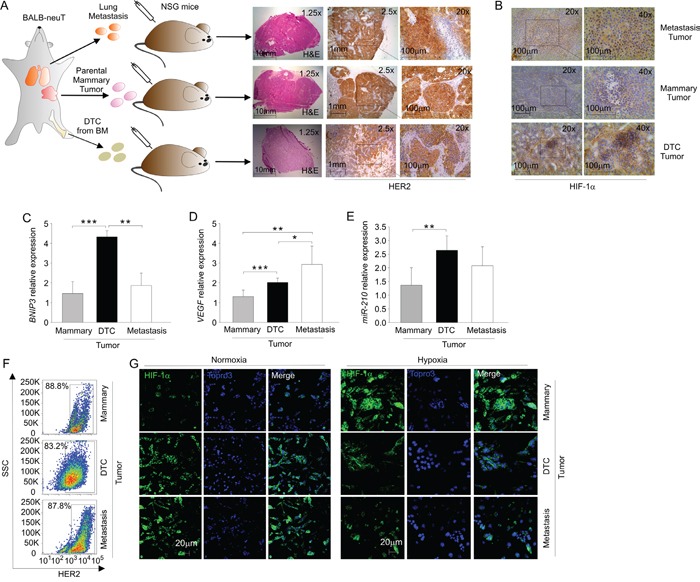
A. Schematic representation of mammary, DTC and metastasis tumor generation; the right panel shows the histopathological analysis of mammary, DTC or metastasis tumors. A representative of each tumor frozen section was stained with H&E and HER2. Light microscopy images were taken at a magnification 1.25x (scale bar 10 mm), 2.5x (scale bar 1 mm) and 20x (scale bar 100 μm). B. Immunohistochemical analysis of HIF-1α expression in metastasis, mammary and DTC tumors. A representative tumor frozen section is shown, photographed at 20x and at 40x magnification. C-D. qPCR analysis of mRNA levels of BNIP3 C. and VEGF D. in mammary, DTC and metastasis tumors. Data represent mean relative expression of mRNA compared to mammary tumor (± SD), expressed as fold change. E. qPCR analysis of miR-210 expression in mammary, DTC and metastasis tumors. Data are expressed as mean values (± SD), relative to the level of miR-210 in mammary tumors. F. Flow cytometric analysis of HER2 expression in mammary, DTC and metastasis tumor cell lines. A representative plot of the percentages of HER2+ cells in the population of mammary, DTC and metastasis tumor cell lines is shown. G. Immunofluorescence analysis of HIF-1α localization in mammary, DTC and metastasis tumor cell lines in normoxic and hypoxic conditions. In green HIF-1α staining, in blue nuclei; scale bar 20 μm. *P < 0.05, **P < 0.01, ***P < 0.001.