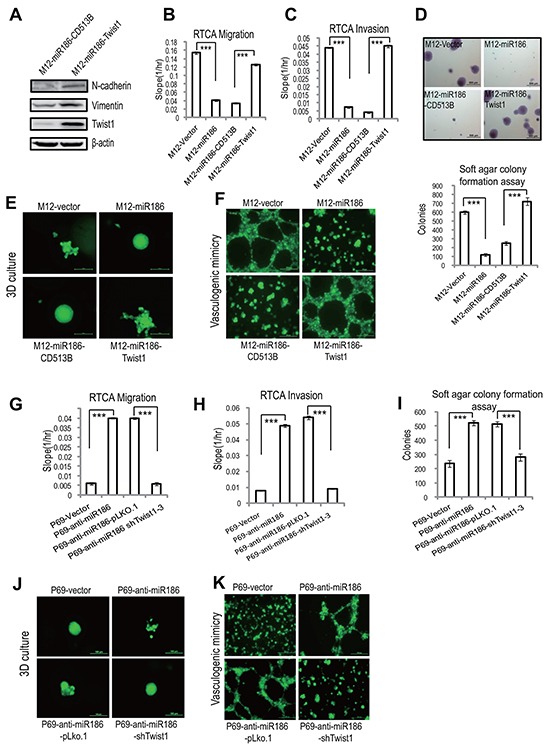
Figure 5. miR186 functions by downregulation of Twist1 in PCa cells.

A. Immunoblotting of epithelial and mesenchymal markers in M12-miR186-Vector and M12-miR186-Twist1 cells. B–C, G–H. RTCA monitoring of cell migration (B, G) or invasion (C, H). M12 group (M12-Vector, M12-miR186, M12-miR186-CD513B and M12-miR186-Twist1 in B–C) or P69 group (P69-Vector, P69-anti-miR186, P69-miR186-pLKO.1 and P69-anti-miR186-shTwist1-3 in G–H) cells were seeded into a CIM-Plate without or with pre-coated matrigel (1:40) and subjected to a dynamic analysis lasting for 48 or 72 h, respectively. The migration or invasion slope was shown as histogram. Error bars indicate ±SD, P-values of < 0.001 (***). (also see Supplementary Figure S3B–3C, 3F–3G). D, I. Soft agar colony formation assays for above stable M12 group (D) and P69 group cells (I). The culture medium containing 5% FBS with 0.35% agar and layered onto the base. Representative images of colonies were taken (top panel) and the number of colonies was counted for each well of six-well plates and shown (bottom panel). The experiments were repeated by three independent times with triplicates each. Error bars indicate ±SEM, P-values of < 0.001 (***). E–F, J–K. 3D culture growth assays (E, J) and VM assays (F, K) for above stable M12 group (E–F) and P69 group cells (J–K). Representative images of cell morphology and vasculogenic networks in extracellular matrix were taken.
