
Figure 1.
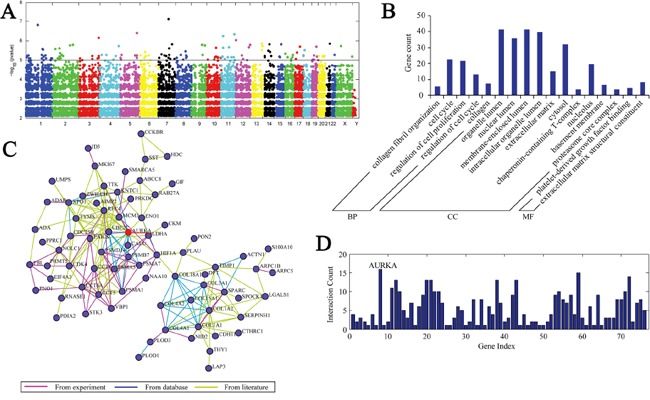
A. eGWAS for gastric cancer using a Fisher's exact test. Plot of –log10(P value)(y axis) by chromosomal position(x axis). P values for each gene were calculated from our eGWAS across 13 microarray experiments with 679 gastric cancer case-control microarray samples(251 cases and 428 controls). The red line indicates P =0.00001, and there were 184 genes P<0.00001. B. These 184 differential genes were categorized into three groups—biological process, cellular component and molecular function—through gene ontology analysis. The results showed that there was enrichment in the cell cycle and collagen. C. D. Network analysis demonstrated that AURKA is the center of the network and consisted of 184 differential genes.