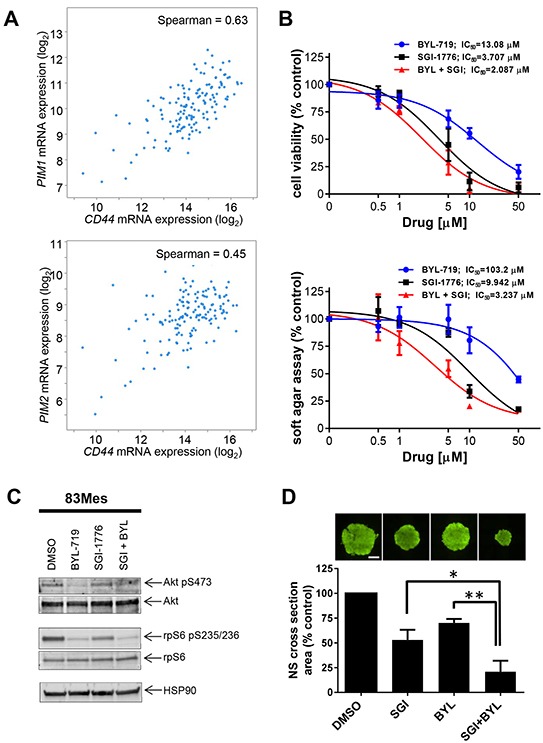
Figure 5. PIM kinase targeting enhances the inhibitory effects of PI3K inhibitors on patient-derived GSCs.

A. RNAseq data from n = 154 GBM patient samples (TCGA Research Network), was used to compare CD44 expression with expression of PIM1 (upper panel) or PIM2 (lower panel). Visualization of the data was performed using the cBioPortal [29, 30]. B. upper panel: 83Mes GBM mesenchymal stem cells were plated in 96-well plates and treated with increasing concentrations of the PIM inhibitor SGI-1776 and/or PI3K inhibitor BYL-719 for 5 days. Cell viability was assessed using WST-1 proliferation assay. Results represent the means ± SEM of 3 independent experiments. Lower panel: 83Mes GBM mesenchymal stem cells were plated in 96-well plates in soft agar and treated with increasing concentrations of PIM inhibitor SGI-1776 and PI3K inhibitor BYL-719 for 7 days. Colony formation was quantified using the fluorescent cell stain CyQUANT GR Dye (Cell Biolabs Inc.) in the Synergy HT Plate reader. Data are expressed as percentages of control DMSO treated samples. Results represent the means ± SEM of 3 independent experiments. C. 83Mes GBM mesenchymal stem cells grown as neurospheres were treated with SGI-1776 (5 μM) and with BYL-719 (10 μM) for 90 min. Lysates were analyzed by SDS-PAGE and immunoblotted with the indicated antibodies for HSP90, rpS6 and its phosphorylated form (pSer235/236) simultaneously. Membrane was stripped and reprobed with antibodies for AKT and its phosphorylated form (pSer473) simultaneously. D. 83Mes GBM mesenchymal stem cells were treated with SGI-1776 (2 μM) and/or BYL-719 (5 μM). After 7 days, neurospheres were stained with Acridine Orange at a concentration of 0.1 μg/ml for 1 hour. Subsequently, neurosphere cross-section area was determined by microscopic analysis using a Nikon Eclipse TE inverted microscope with automated stage as described in materials and methods. Representative images of neurospheres are depicted (upper panels). Scalebar = 500 μm. Means + SEM of the values from 4 independent experiments (each done in five technical replicates) are shown (lower panel). Comparisons between drug treatments were performed using paired, two-tailed t-tests, * < 0.05, ** < 0.01.
