
Figure 3. c-MYC regulates HIF1A transcription activity.
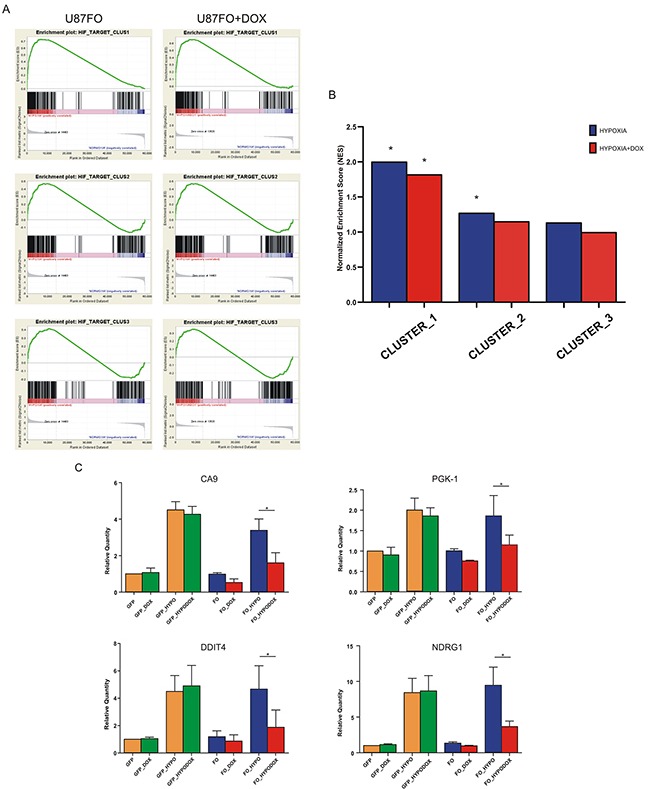
A. GSEA of the three HIF1A gene clusters. The analysis were performed on gene expression data obtained from hypoxic versus normoxic U87FO cells (left) and from hypoxic-DOX-treated U87FO cells versus normoxic U87FO cells (right). B. Graph bars indicate NESs * FDR q value < 0.05. C. Quantitative Real Time RT-PCR on CA9, PGK1, DDIT4 and NDRG1 in U87GFP cells and U87FO cells. Relative Quantities were calculated normalizing for TBP and are given relative to U87GFP. n= 3 biological replicates * p value < 0.05.