
Figure 4. HIF1A controls metabolic profile in a c-MYC dependent manner.
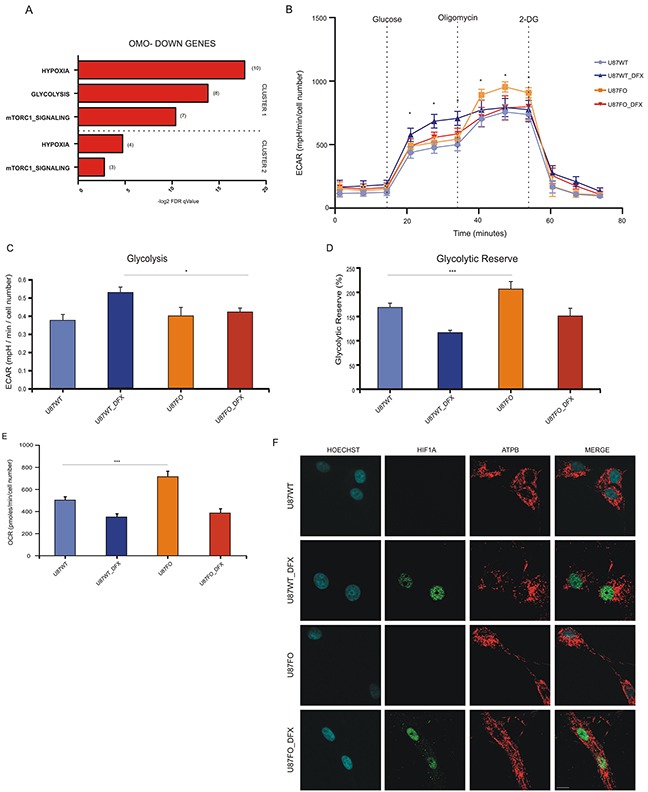
A. Computational overlap analysis between Omo-down genes and Hallmark gene sets from MSigDB. B. Extracellular acidification rate (ECAR) in U87WT and U87FO treated or not with DFX. Glucose, Oligomycin A and 2-Deoxy-D-glucose (2-DG) were injected at the indicated time points. Data show mean ± SD. * p<0.05. See also Supplementary Figure S5a. All cellular groups employed were treated with DOX in order to avoid out of target effects due to this treatment. C. Glycolysis in U87WT and U87FO treated or not with DFX. Glycolysis is calculated by subtracting basal ECAR levels to ECAR levels measured after glucose injection (see Supplementary Figure S5a). Bar graphs represent mean ± SD of the three measurements in basal and after glucose injection at the indicated time points. * p < 0.05. D. Glycolytic reserve in U87WT and U87FO cells treated or not with DFX. Glycolytic reserve is calculated by subtracting ECAR measured after glucose injection from ECAR measured after oligomycin A injection (see Supplementary Figure S5a). Bar graphs represent mean ± SD of the three measurements after glucose and oligomycin A injection at the indicated time points. * p < 0.05. E. Oxygen consumption rate (OCR) in U87WT and U87FO cells treated or not with DFX. Data presented as mean ± SD of the three measurements in basal conditions. *** p< 0.005. F. Staining of ATPB and HIF1A in U87WT and U87FO cells treated or not with DFX. Scale bar, 10μm. All cellular groups employed were treated with DOX in order to avoid out of target effects due to this treatment.