
Figure 1. Biodistribution of trastuzumab.
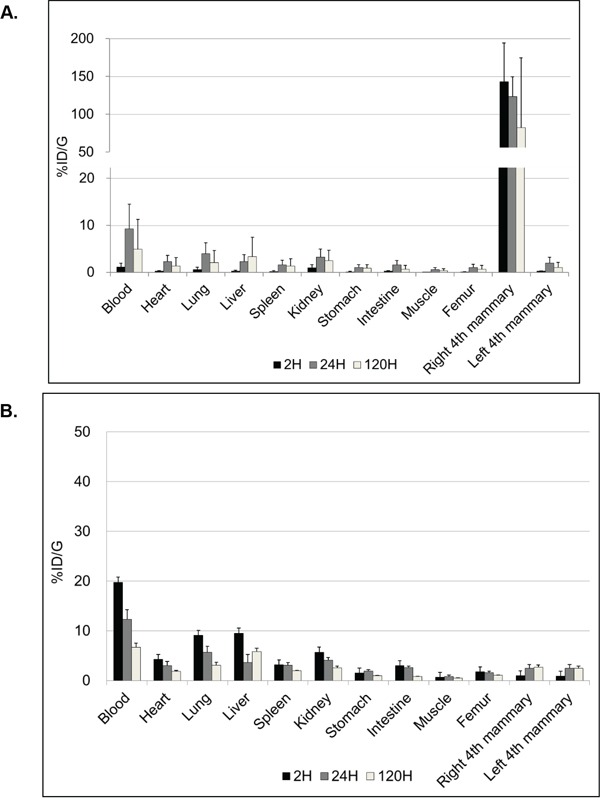
%ID/g graphs show different patterns of biodistribution of trastuzumab at 2, 24, 120 hours after i.duc A. or tail vein B. injection (three mice per time point). The peak of %ID/g in the blood was 9.3 ± 5.3% at 24 hours after i.duc. %ID/g = (activity in each organ) X100/(actual injected activity) per gram for each organ. Data are expressed as %ID/g+/−SD.