Fig. 2.

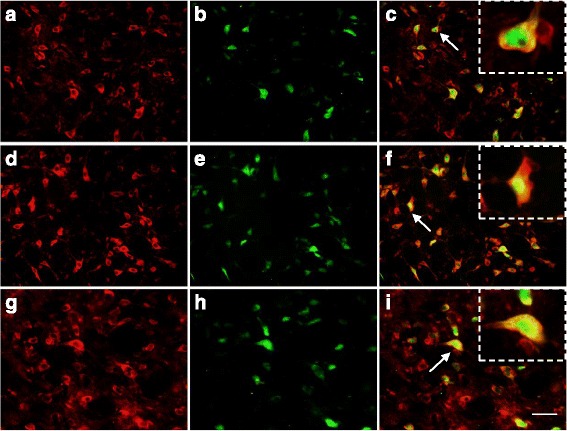
Co-localization images of Nrf2 with NeuN in TNC. Red indicates Nrf2 immunoreactivity, green indicates NeuN immunoreactivity, and yellow indicates merged signal. In control group a-c of the TNC, Nrf2 is present mainly in the cytoplasm (shown by arrows). In the NTG 2 h group d-f and NTG 4 h group g-i, Nrf2 staining was observed both in the cytoplasm and in the nucleus (shown by arrows). Bar = 50 μm. The arrows indicate cells shown in the top right corner of images c, f, i at about 10 times magnification
