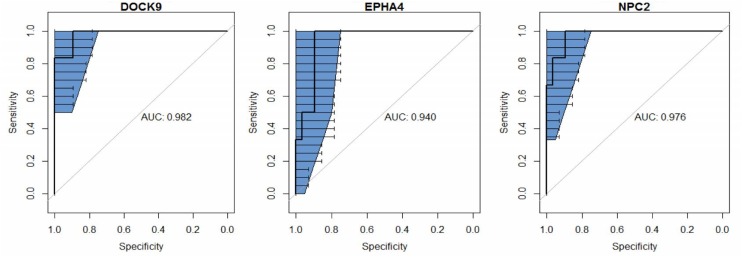
FIGURE 1.
Receiver operating characteristic (ROC) curve analysis and the respective areas under the curve (AUC) with 95% confidence intervals (blue), comparing peripheral blood DOCK9. EPHA4, and NPC2 gene expression profiles, obtained via RNA sequencing, between recent close tuberculosis (TB) contacts (rCt, n = 28) and patients with pulmonary TB (n = 6) for the screening of target genes for Mycobacterium tuberculosis infection.

