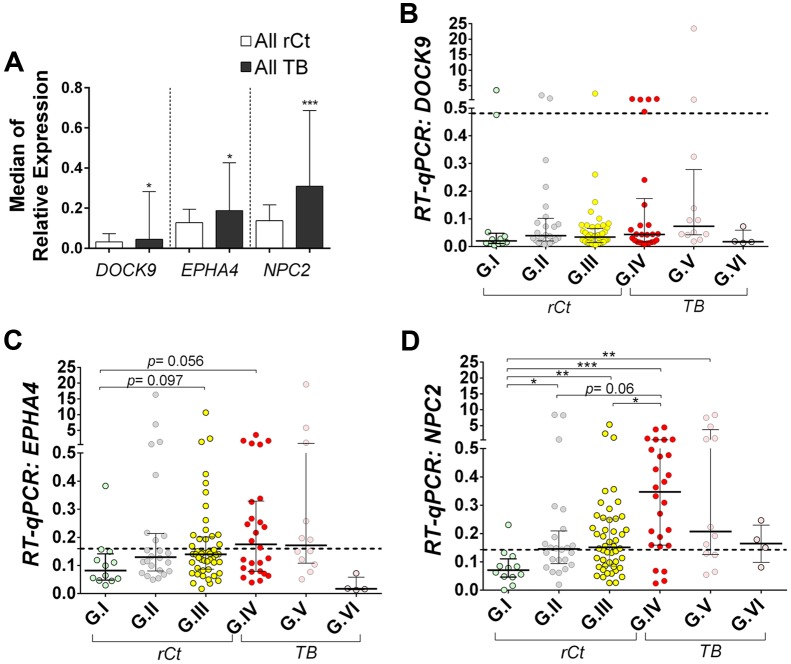
FIGURE 2.
Relative expression of DOCK9, EPHA4, and NPC2 mRNAs in whole blood, as obtained with quantitative real-time PCR (RT-qPCR). RPL13A mRNA was used as reference (housekeeping) gene. All participants were recruited from the broad population of routine clinical practice at public hospitals in Rio de Janeiro/Brazil. Data are shown as median ± interquartile range. (A) Comparison between all healthy recent close TB contacts (rCt) and patients with pulmonary tuberculosis (TB). Mann–Whitney U-test; ∗p < 0.05 and ∗∗∗p < 0.001. (B–D) Comparison between healthy recent close TB contacts (rCt) stratified in three groups according to probability of latent tuberculosis infection: (G.I, n = 12) very low, (G.II, n = 24) low to moderate, and (G.III, n = 48) moderate to high; and tuberculosis (TB) cases grouped by the time elapsed between the anti-TB treatment onset and the blood collection for this study (G.IV: 0–2 days, n = 29; G.V: 3–6 days, n = 12; and G.VI: ≥7 days, n = 4). (B) DOCK9, (C) EPHA4, and (D) NPC2 gene expression. The Kruskal–Wallis test was used to access significance of global differences across groups (DOCK9 p = 0.039, EPHA4 p = 0.059 and NPC2 p < 0.0001), among rCt (DOCK9 p = 0.276, EPHA4 p = 0.079 and NPC2 p = 0.005) or TB (DOCK9: p = 0.18; EPHA4: p = 0.38; and NPC2: p = 0.28), followed by Dunn’s Multiple Comparison test (∗p < 0.05, ∗∗p ≤0.005, and ∗∗∗p ≤ 0.001).

