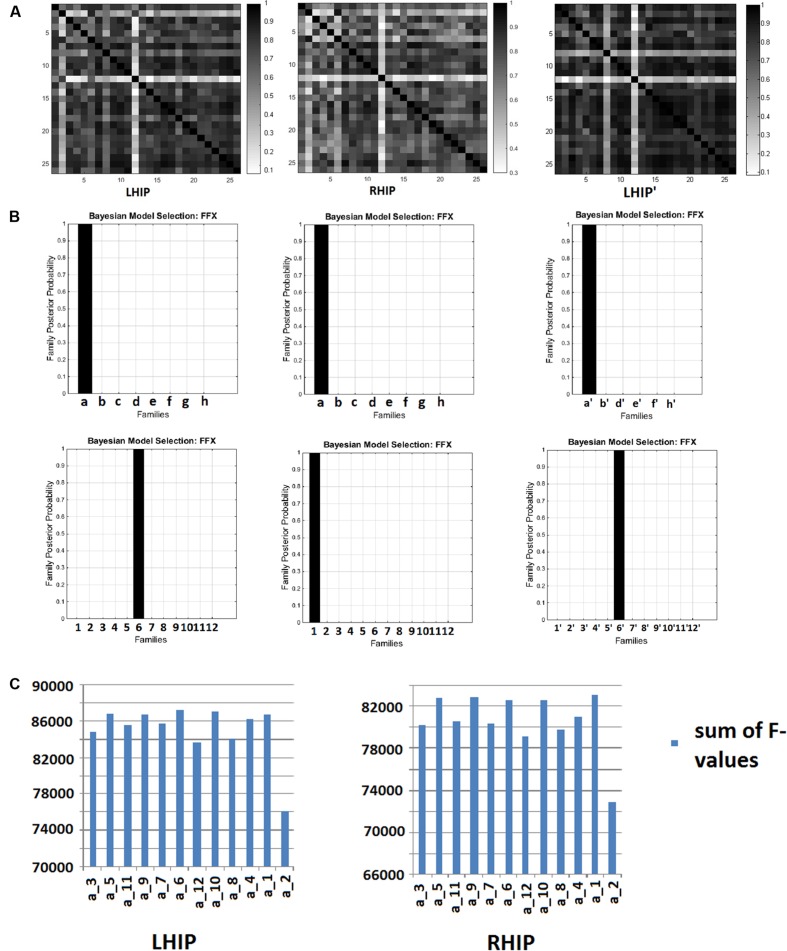
FIGURE 4.
Bayesian model selection (BMS) results. (A) F-values correlation matrices across 26 subjects. LHIP – for 96 models with LHIP inclusion, RHIP - for 96 models with LHIP inclusion, LHIP’ - for 72 models with LHIP inclusion and PCC exclusion. (B) Model families posterior probabilities: for LHIP inclusion the winning families are a and 6, for RHIP inclusion the winning families are a and 1, for LHIP inclusion and PCC exclusion – a′ and 6′. (C) Sums of F-values across 26 subjects for winning family a. Models a_5, a_9, a_6, a_10, a_1 are performing better than others both for LHIP and RHIP inclusion. Absolute winners are models, which combined each winning family: a_6, a_1, and a′_6′.

