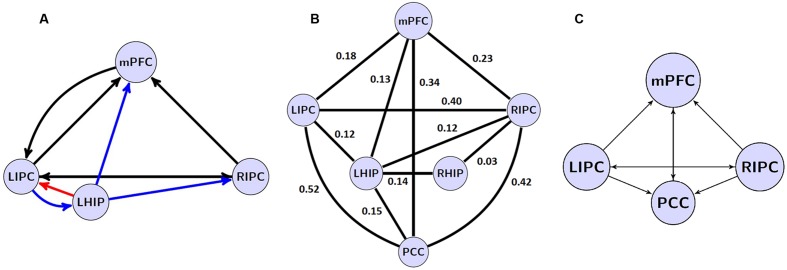
FIGURE 6.
(A) the winning model at the group level without PCC region and its non-trivial significant (p < 0.05) connections. Blue arrows depict LHIP/RHIP effective connections with the base DMN sources, red arrow depicts the only connection, which parameter changed significantly (p < 0.05). (B) significant (p < 0.05) coefficients of functional connectivity between the six ROIs of the DMN. (C) The model with four basic ROIs taken from (Sharaev et al., 2016).

