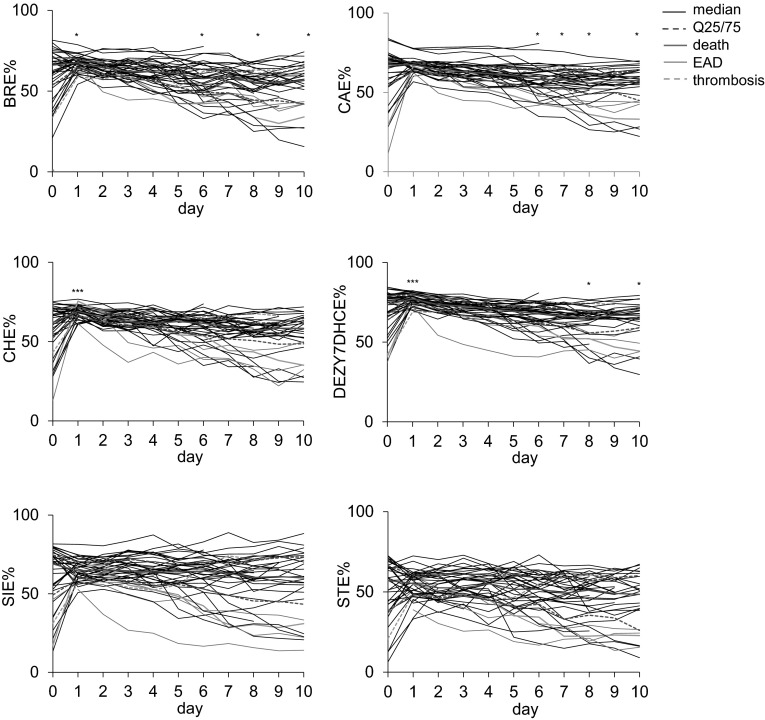
Fig. 1.
Time course of the ratio of esterified sterols The median and the 25 and 75 % interquartile ranges (Q25/75) are shown in red. The patients who died within 3 months (n = 3) and the patients with organ failure (n = 2) are shown in pink and in green, respectively. The continuous green line represents a patient with EAD and high MEAF whereas the green broken line indicates a patient who lost the liver 2 months post-LTX due to thrombosis of the hepatic artery. The differences between day 0 pre-LTX to each day post-LTX are indicated (Wilcoxon signed-rank test; ∗p < 0.05, ∗∗p < 0.01, ∗∗∗p < 0.001)

