Fig. 3.
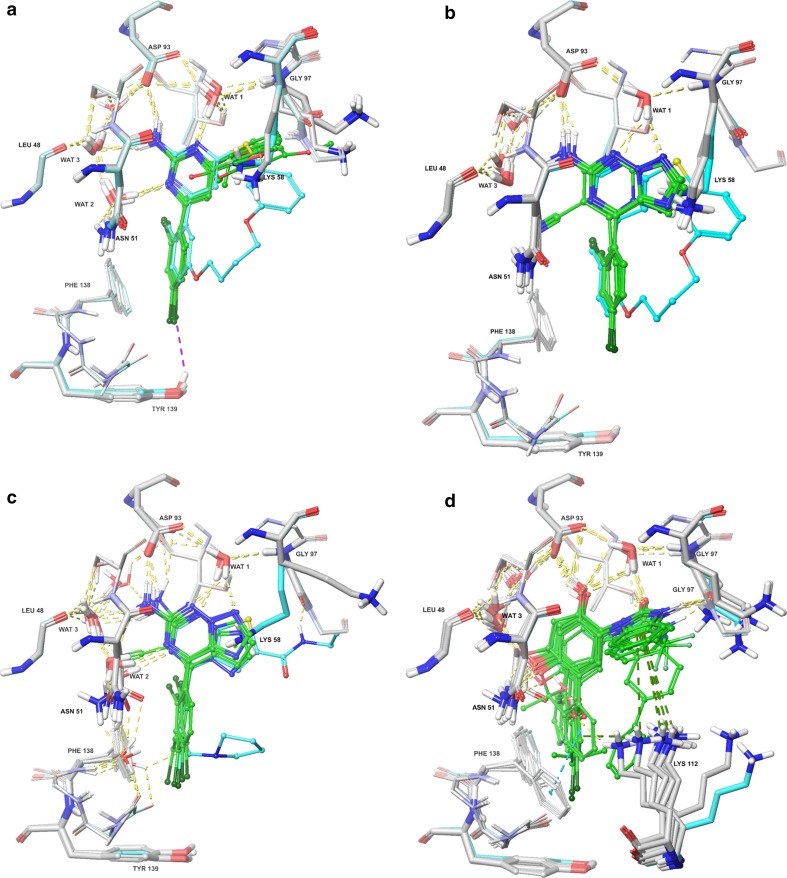
Binding modes for the three series of HSP90 inhibitor from the docking calculations: a set 1, b original docking for set 2, based on the 3VHA crystal structure (submitted), c set 2 in the 2WI7 crystal structure, keeping all water molecules, and d set 3. Carbon atoms of the residues are shown in light grey tubes, showing some movements as result of the induced-fit docking protocol. Carbon atoms of the ligands are shown as green tubes. Water molecules that interact with the ligands are displayed in thick tube representation and labelled as WAT. Reference crystal structures (3VHA, 2WI7, and 3OW6 [36, 37, 39]) are coloured in cyan for comparison (both ligands and protein). Nitrogen and oxygen atoms are blue and red, respectively. Hydrogen bonds are represented as yellow dashed lines (purple if the acceptor is a halogen atom). Cation-π and π-stacking interactions are represented as dark green and dark cyan dashed lines, respectively

