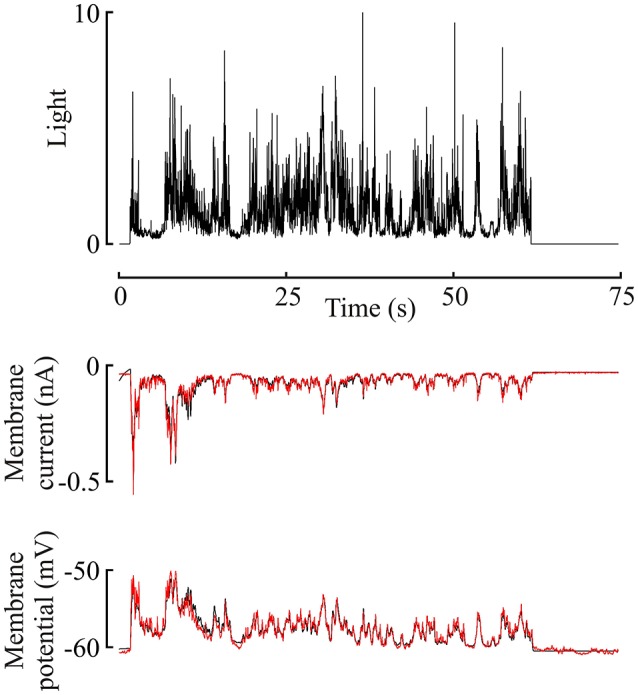
Figure 2.

Membrane current and potential changes in a Periplaneta photoreceptor during 60 s naturalistic light stimulation (van der Schaaf and van Hateren, 1996). Light stimulus in the upper trace, with membrane current and potential in the middle and lower traces, respectively. This light level gave an estimated mean response of 620 ep/s. Experimental current and potential (black) are plotted with superimposed responses from the model of Figure 1 to the same stimulus (red), using the best-fitting parameters for this data. Note, that model data reproduces experimental data well-enough to obscure most of the underlying (black) plot.
