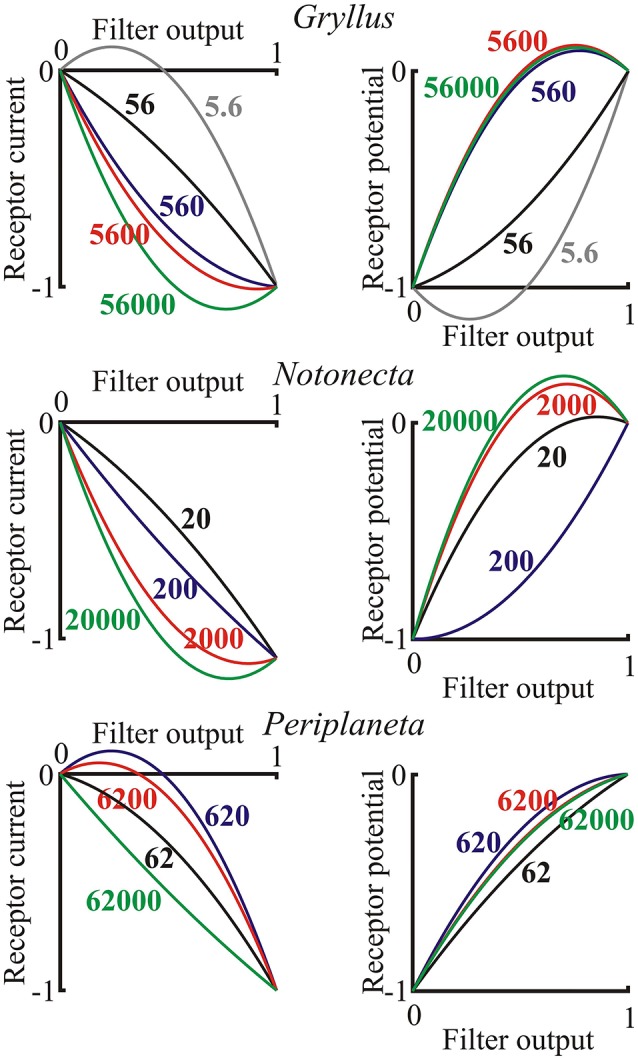
Figure 6.

Nonlinear functions representing the final stage of the photoreceptor model (Figure 1) for both receptor current and receptor potential. Axes were normalized to the output range of the filter function, as input, and the final current or potential range as output. Data are shown for single examples of the three species as functions of the input light intensity in effective photons per second, indicated on each curve. Note, that these are only second-order polynomials, so output values exceeding the inputs in some cases are only approximations to the final nonlinearity, which would probably be reduced by higher order terms.
