
Figure 2.
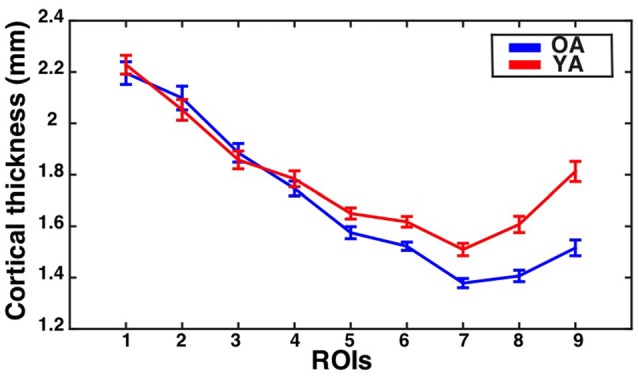
Cortical thickness (CT) for the V1 bar ROIs as a function of eccentricity for younger and older adults. Mean ± standard error of the mean for CT is shown for each group at each bar ROI. Values for older adults are plotted in blue, while values for younger adults are plotted in red.