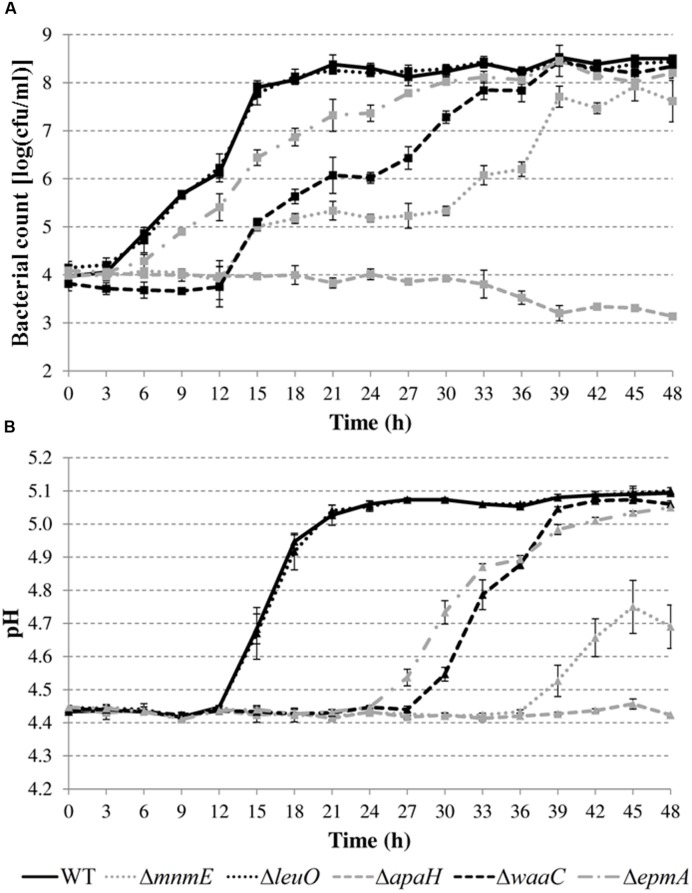
FIGURE 5.
Cell numbers (A) and pH values (B) during growth of E. coli MG1655 WT and deletion mutants in LB pH 4.40 at 30°C. Error bars represent standard deviations for three independent replicates. The corresponding growth parameters are shown in Table 4.

