Figure 1.
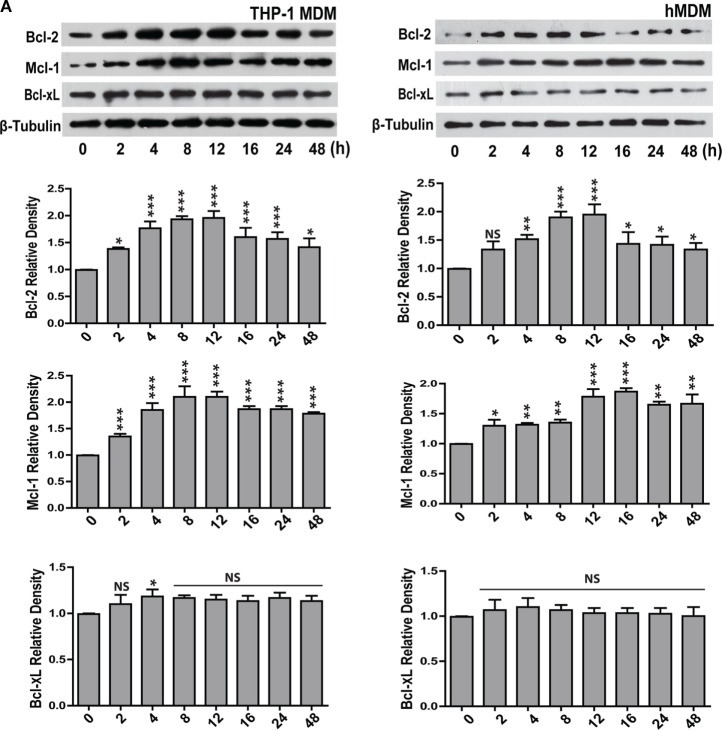
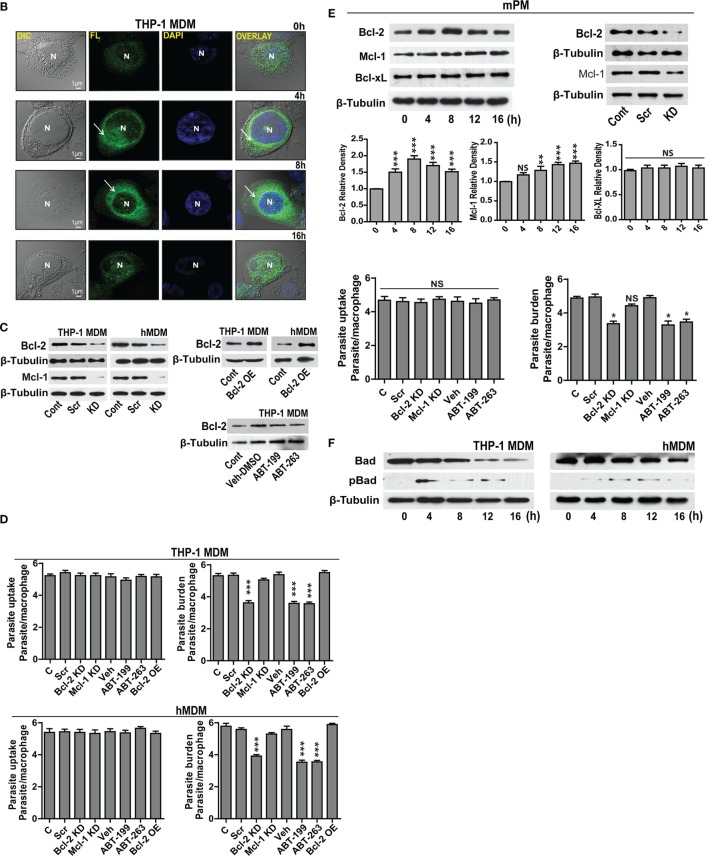
Expression of Bcl-2 and Mcl-1 increases during L. donovani infection. (A) Bcl-2, Mcl-1, and Bcl-xL protein levels in extracts of THP-1 MDM and hMDM infected with L. donovani parasites in vitro. Note the increase in Bcl-2 from 2 h onward. Blots are representative of three experiments. Densitometric plots are shown below. Data are mean ± SD (n = 3). (B) Immunocytochemical staining of infected THP-1 MDM using anti-Bcl-2 antibody at different time points post-infection. Note increased Bcl-2 expression at 8 h showing predominantly perinuclear distribution as indicated by white arrows. N = nucleus. (C) Blots showing siRNA mediated downregulation of Bcl-2 and Mcl-1 in THP-1 MDM and hMDM. Control is without any siRNA. Scr, scrambled siRNA; KD, knockdown. Also shown is overexpression of Bcl-2 in THP-1 MDM and hMDM. OE, overexpression. Control is only plasmid, OE, overexpression. Blots are representative of three experiments. The blot below shows control Bcl-2 levels during treatment with only vehicle (DMSO) or ABT-199 or ABT-263. Bcl-2 levels remained unaffected upon these treatments. (D) Plots show parasite uptake and parasite burden during various conditions. Average parasite counts per macrophage have been put on the y-axis. A minimum of 200 cells was counted. Data are mean ± SEM (n = 3); ***P ≤ 0.001; Mann–Whitney test. Parasite uptake remained unaltered. Note significant reduction of parasite burden in siRNA or ABT-199-treated Bcl-2 downregulated cells. (E) Western blots of lysates of infected mPM stained for Bcl-xL, Bcl-2, and Mcl-1 showing increased expression for Bcl-2 which peaks at 8 h post-infection. Blots are representative of three experiments. Shown below are the densitometric plots. Data are mean ± SD (n = 3). Alongside are blots showing siRNA0-mediated downregulation of Bcl-2 and Mcl-1 in mPMs. Control is without any siRNA. Scr, scrambled siRNA; KD, knockdown. Shown below are bar graphs expressing parasite uptake and parasite burden during various treatments. Note significantly reduced parasite burden in Bcl-2 KD and ABT-199/ABT-263-treated macrophages. A minimum of 200 cells was counted. Data are mean ± SEM (n = 3); *P ≤ 0.05; Mann–Whitney test. (F) Western blots from THP-1 MDM and hMDM showing time-dependent degradation of Bad protein during infection. Bad protein undergoes degradation post phosphorylation. The blot below shows Bad phosphorylation upon infection. Blots are representative of three experiments.


