Figure 2.

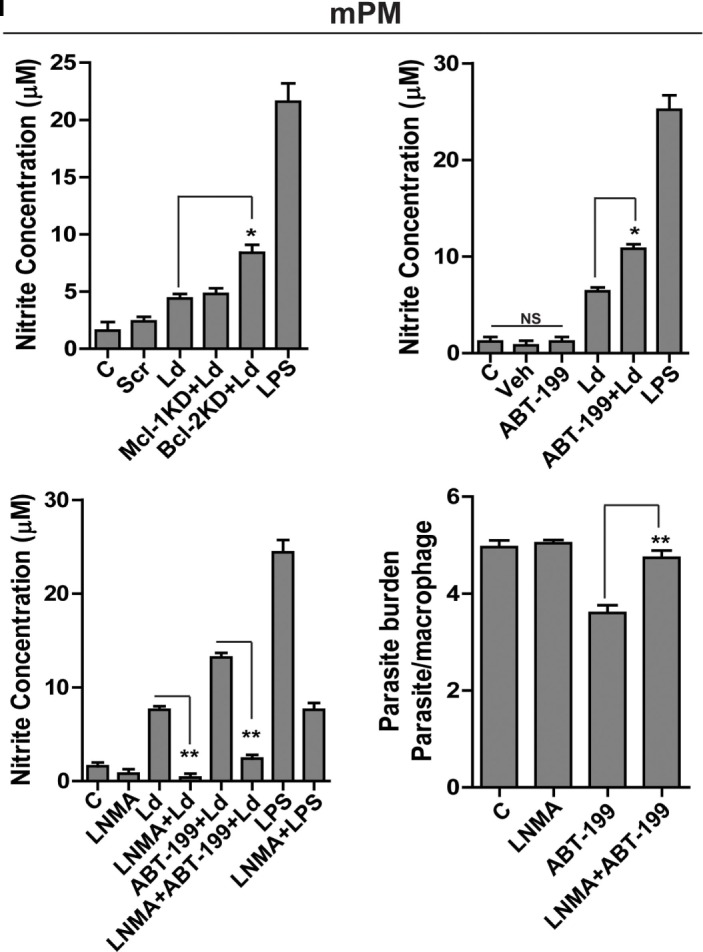
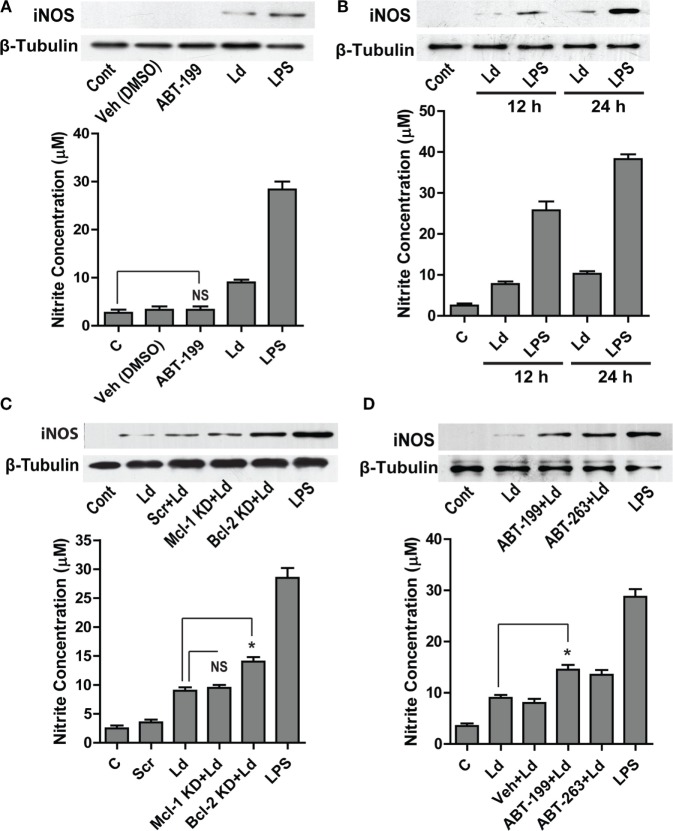
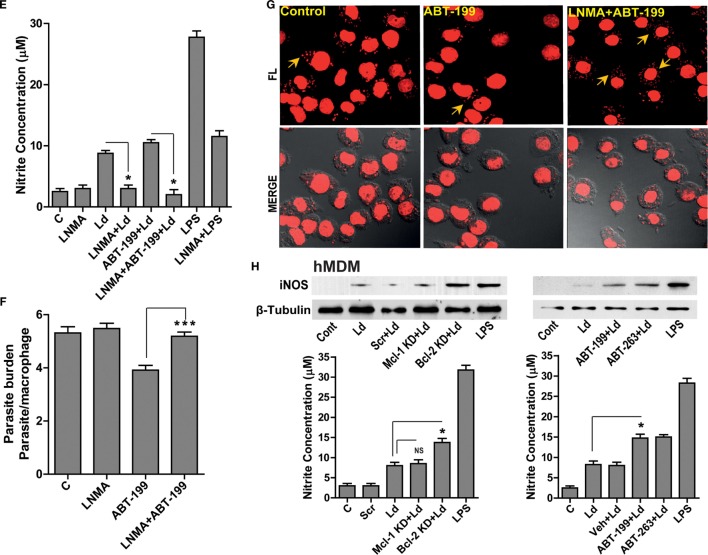
Bcl-2 increase contributes to iNOS suppression. (A) Western blot showing iNOS levels during control treatments and upon infection for 24 h. (B) iNOS levels at 12 and 24 h post infection. LPS has been taken as a positive control. (C) Blot showing higher iNOS expression at 12 h post-infection during Bcl-2 downregulation by siRNA to Bcl-2. Note no significant change after inhibition with siRNA to Mcl-1. Ld, Leishmania donovani; KD, knockdown; Scr, scrambled siRNA. (D) Western blot of THP1-MDM extracts at 12 h post-infection, showing higher levels of iNOS when Bcl-2 protein was inhibited by ABT-199/ABT-263. The bar graphs below the western blots in (A–D) show nitrite levels in soups obtained from corresponding experiments. Note the correspondence between iNOS expression and the nitrite levels in all the above experiments. (E) Nitrite concentrations at 12 h after treatment with Bcl-2 inhibitor ABT-199 and LNMA, iNOS inhibitor. Data are mean ± SEM (n = 3). *P ≤ 0.05; Mann–Whitney test. (F) Parasite burden 12 h postinfection in THP-1 MDM in the presence of Bcl-2 inhibitor ABT-199 and iNOS inhibitor, LNMA. Data are mean ± SEM (n = 3). ***P ≤ 0.001; Mann–Whitney test. (G) Photomicrograph of infected THP-1 MDM treated with LNMA and ABT-199. Note the loss of ABT-199-conferred reduction in parasite burden upon inhibition of iNOS activity by LNMA. The yellow arrows indicate intracellular parasites. (H) Representative Western blots from the lysates of hMDMs showing increased iNOS expression at 12 h upon Bcl-2 KD and in the presence of Bcl-2 inhibitors ABT-199/ABT-263. The bar graphs below represent corresponding nitrite levels. Ld, Leishmania donovani; KD, knockdown; Scr, scrambled siRNA. Data are mean ± SEM (n = 3). *P ≤ 0.05; Mann–Whitney test. (I) First three bar graphs show nitrite concentrations at 12 h after parasite infection of mPMs upon Bcl-2, Mcl-1 KD or treatments with Bcl-2 inhibitors, ABT-199/ABT-263 and upon inhibition of iNOS activity using LNMA treatment. The fourth bar graph shows increased parasite burden in LNMA-treated mPMs even in the presence of ABT-199. Ld, Leishmania donovani; KD, knockdown; Scr, scrambled siRNA; mPM, mouse peritoneal macrophage. Data are mean ± SEM (n = 3). *P ≤ 0.05, **P ≤ 0.01; Mann–Whitney test.


