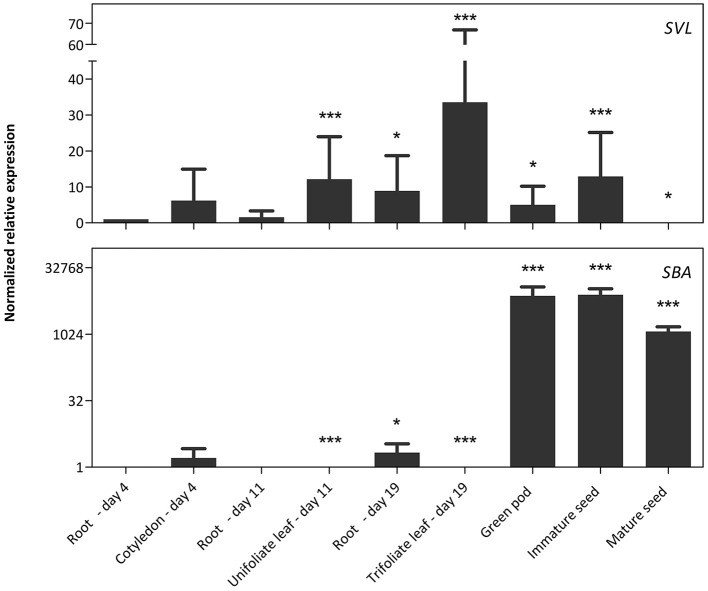
Figure 4.
Normalized relative expression profile of SVL and SBA during soybean development. The normalized transcript levels of all genes are represented relative to the expression of 4-day-old roots. The data represent three independent biological replicates, error bars indicate standard errors and statistically significant differences to the expression level of 4-day-old roots are indicated with asterisks (*p < 0.05, ***p < 0.001).

