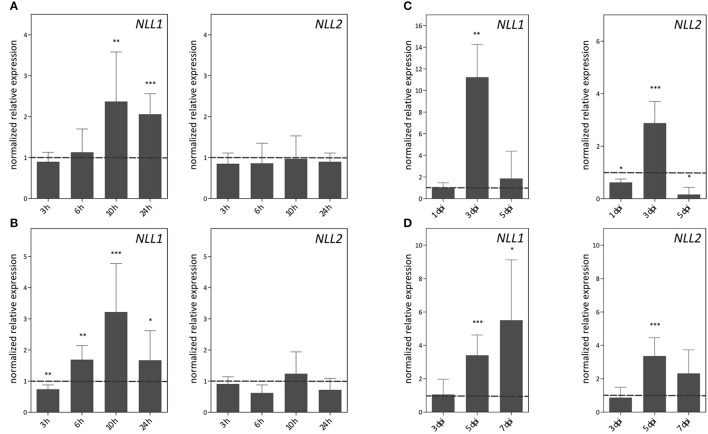
Figure 5.
Expression patterns of GmNLL1 and GmNLL2 under different stress conditions, determined by RT-qPCR. Expression patterns under salt stress on leaf (A) and root (B) material; (C) transcript levels in leaf material upon Phytophthora sojae infection and (D) Aphis glycines infestation. The normalized expression levels, relative to the control treatment (set to 1) at the indicated time points are shown. The mean values of RT-qPCR from three independent biological replicates were normalized to three reference genes and error bars indicate standard errors. Asterisks indicate statistically significant differences compared to the control treatment (*p < 0.05, **p < 0.01, ***p < 0.001).

