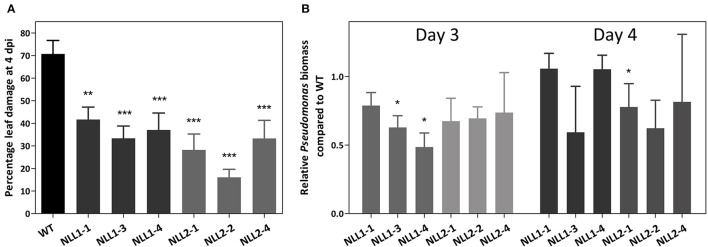
Figure 9.
(A) Disease symptoms on wild type and transgenic Arabidopsis lines after infection with Pseudomonas syringae. Percentage leaf damage of infected leaves at 4 dpi was determined in Assess 2.0 and represents two biological replicates. Error bars ± SE, asterisks indicate significant differences compared to the wild type. (B) Relative Pseudomonas biomass in the overexpression lines, compared to the Pseudomonas biomass in wild type plants. Analysis was performed on infected leaves at 3 dpi (left panel–light gray) and 4 dpi (right panel–dark gray). qPCR data were normalized with two Arabidopsis reference genes in REST-384 and represents two biological replicates. Error bars ± SE, asterisks indicate significantly different ratios of the transgenic lines compared to wild type (*p < 0.05, **p < 0.01, ***p < 0.001).

