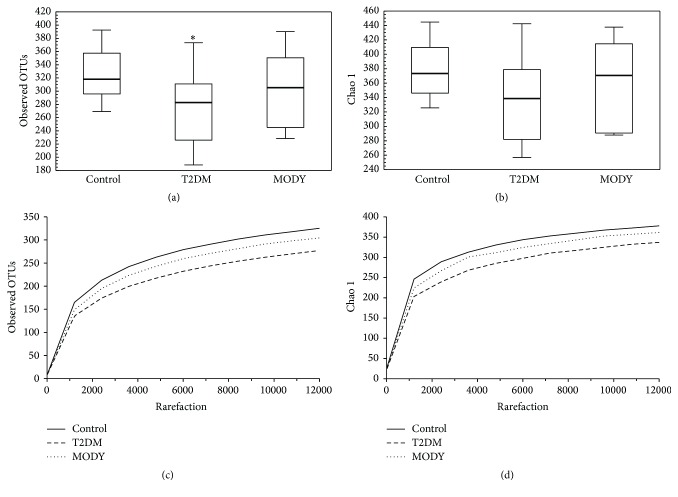
Figure 4.
Box plots showing the alpha diversity ((a) observed OTUs, (b) Chao 1) comparison between groups. The rarefaction plots comparison ((c) observed OTUs, (d) Chao 1). Bold line: median; black lines: range of values. The observed OTUs but not Chao 1 alpha diversity were lower in T2DM group than in the control group. There were no significant differences in alpha diversity between T2DM and MODY and MODY and control groups. (a) Observed OTU alpha diversity: control versus MODY, p = 0.846; control versus T2DM, p = 0.027; MODY versus T2DM, p = 0.726. (b) Chao 1 alpha diversity: control versus MODY, p = 1; control versus T2DM, p = 0.063; MODY versus T2DM, p = 0.816. OTU: operational taxonomic unit; T2DM: type 2 diabetes mellitus; MODY: Maturity Onset Diabetes of the Young. ∗ indicates that there was a significant difference between this group and control group.

