Figure 3.

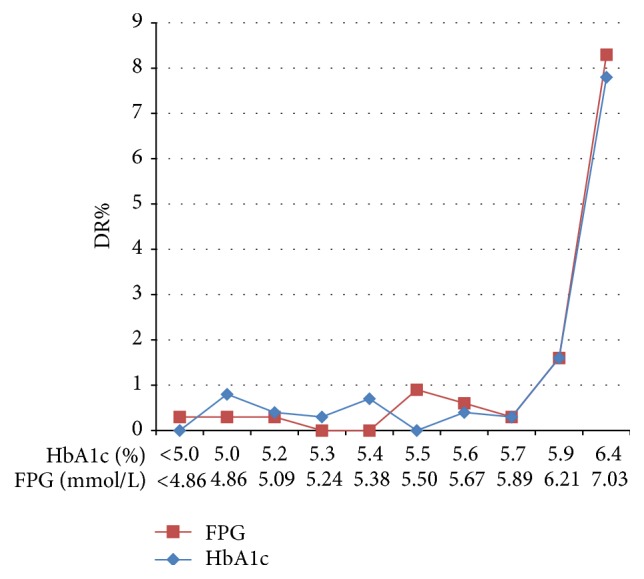
Prevalence of diabetic retinopathy (DR) according to the deciles of distribution of fasting plasma glucose (FPG) and glycated hemoglobin A1c (HbA1c) in the total 3124 subjects. The x-axis indicates the minimum value of each decile group.

Prevalence of diabetic retinopathy (DR) according to the deciles of distribution of fasting plasma glucose (FPG) and glycated hemoglobin A1c (HbA1c) in the total 3124 subjects. The x-axis indicates the minimum value of each decile group.