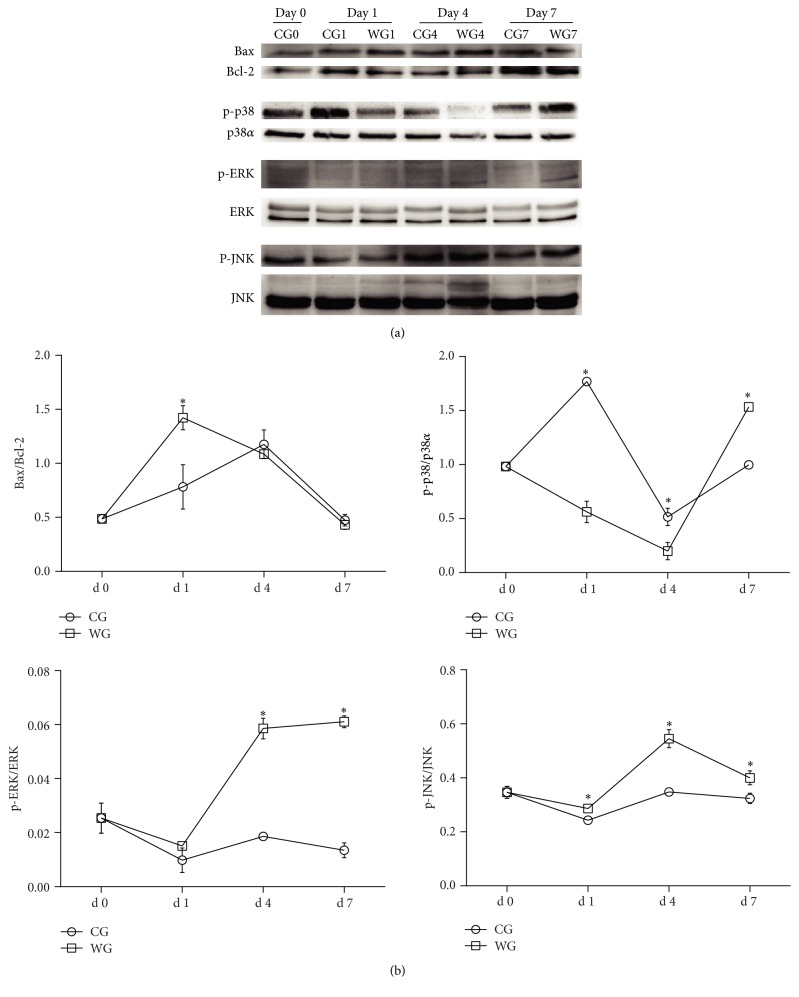
Figure 5.
The protein expression of regulator of apoptosis and MAPK signaling pathways at d 0, 1, 4, and 7 in liver of WG compared with CG (a). The values are calculated as the ratios of Bax and Bcl-2 and their phosphorylation levels (p-JNK, p-p38, and p-ERK1/2) and the total levels of MAPK (b). CG: control group; WG: weaning group. ∗Means are significantly different (P < 0.05) (n = 3). Note: p38 [p38α (C20), SC-535, Santa Cruz] is recommended for detection of p38α as the total protein, while p-p38 [p-p38 (D-8) SC7379, Santa Cruz] is recommended for detection of p38α, p38β, and p38γ correspondingly.

