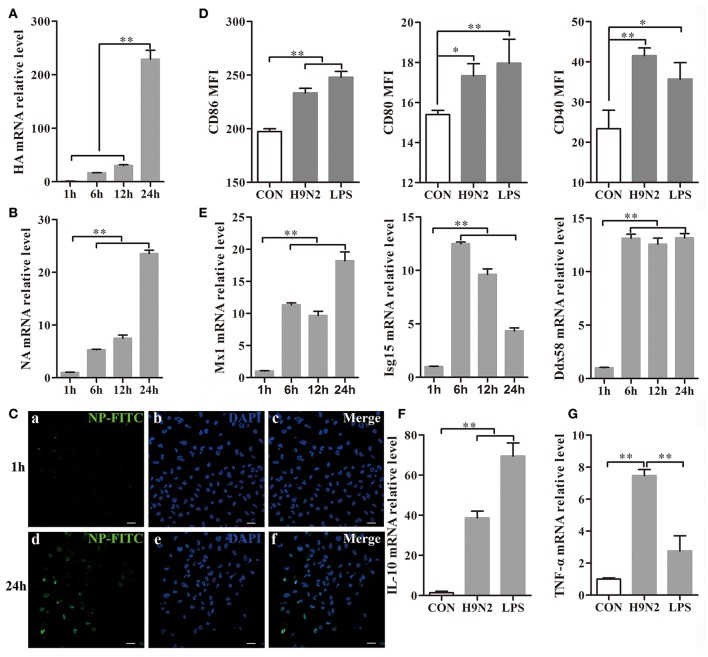
Figure 4.
Efficient replication of the H9N2 virus in DCs and the response of DCs treated with the H9N2 virus. DCs infected with the H9N2 virus were harvested at different time points after infection as indicated. (A,B) The relative HA and NA mRNA levels were evaluated by qRT-PCR. The expression levels of these genes in DCs treated with the H9N2 virus is presented in relation to untreated DCs. (C) The H9N2 virus was detected in DCs by confocal microscopy at 1 h and 24 h post-infection. Bars: 20 μm (D) Then, CD86, CD80, and CD40 expression on the surface of treated and untreated DCs was analyzed at 24 h post-infection by FACS. (E) The relative mRNA levels of Mx1, Isg15, and Ddx58 were evaluated by qRT-PCR. The expression levels of these genes in DCs treated with the H9N2 virus are presented in relation to untreated DCs. (F,G) The gene transcription levels of IL-10 and TNF-α in DCs were analyzed by qRT-PCR 24 h post-infection. *P < 0.05; **P < 0.01. The results are from three different experiments.

