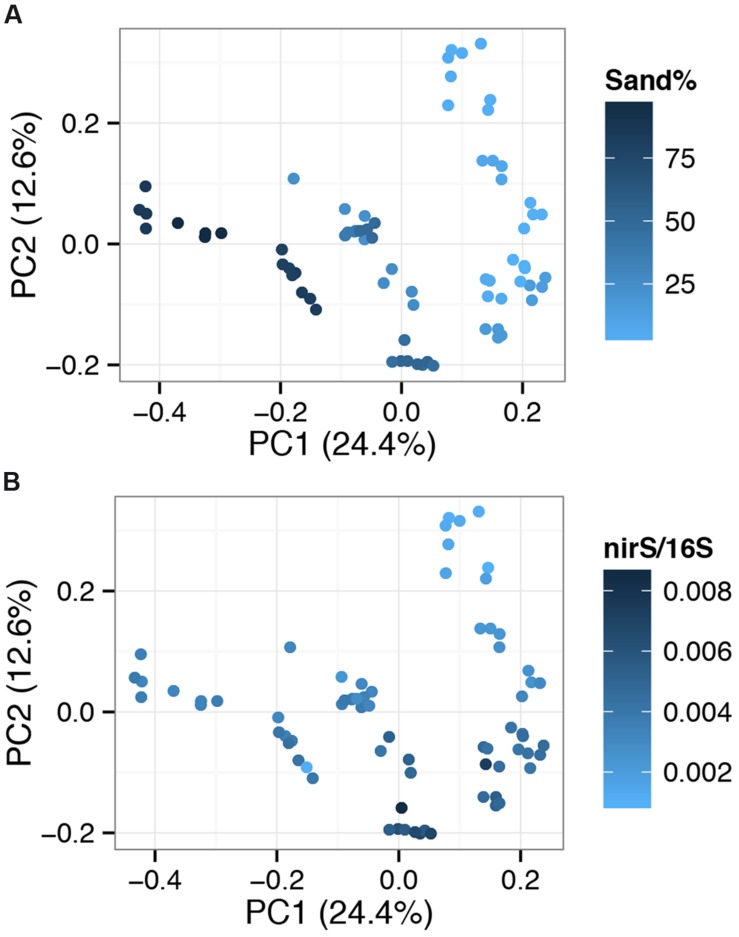
FIGURE 7.
Principal coordinate analysis (PCoA) plots based on OTU (Operational Taxonomic Units grouped at a 97% sequence similarity threshold) level relative abundance data, separated using Bray–Curtis dissimilarity. Sites are color coded by sand% levels (A) or normalized nirS levels (B). Percentages on axes show the variation explained by each component.

