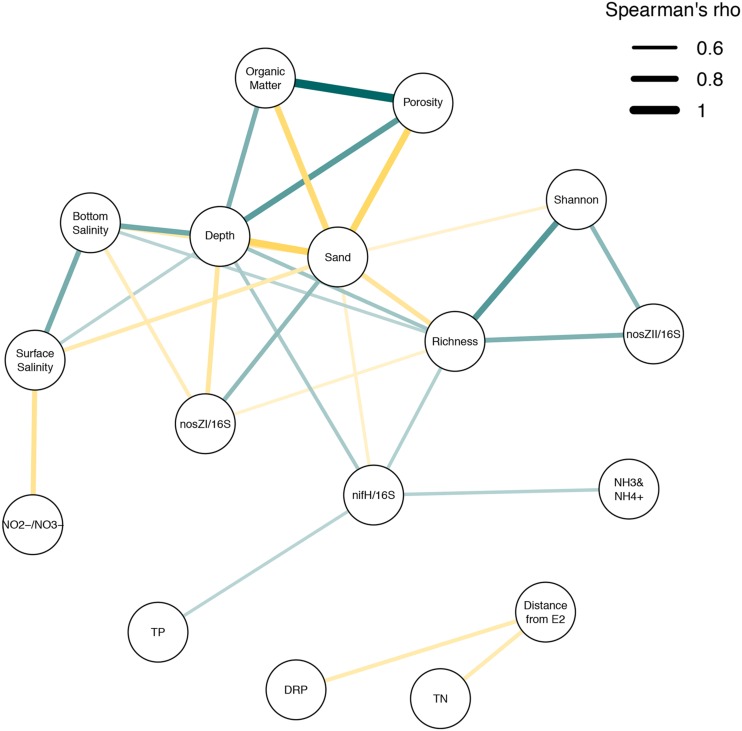
FIGURE 8.
Spearman’s correlation network showing major correlations between measured lake parameters. Spearman’s analysis was carried out on lake metadata. Correlations above a 0.6 Spearmans rho (ρ) cut-off were included in analysis using qgraph and associated dependencies in R. Lines between nodes indicate an association between connected parameters. Node thickness and color intensity explains the strength of association (more intense color/thicker lines represent stronger ρ values. Line colors describe positive (blue) and negative (gold) correlations. TN, Total Nitrogen concentration; TP, Total Phosphorus concentration; NH3 and NH4+, sum of ammonia and ammonium; NO2-+NO3-, sum of nitrite and nitrate; DRP, Dissolved Reactive Phosphorus; Sand, percentage of sediment weight attributable to sand size particles (63–2000 μm); Organic Matter, percentage of sediment weight attributable to organic matter; Porosity, percentage of sediment weight attributable to porewater; Shannon, Shannon Diversity.

