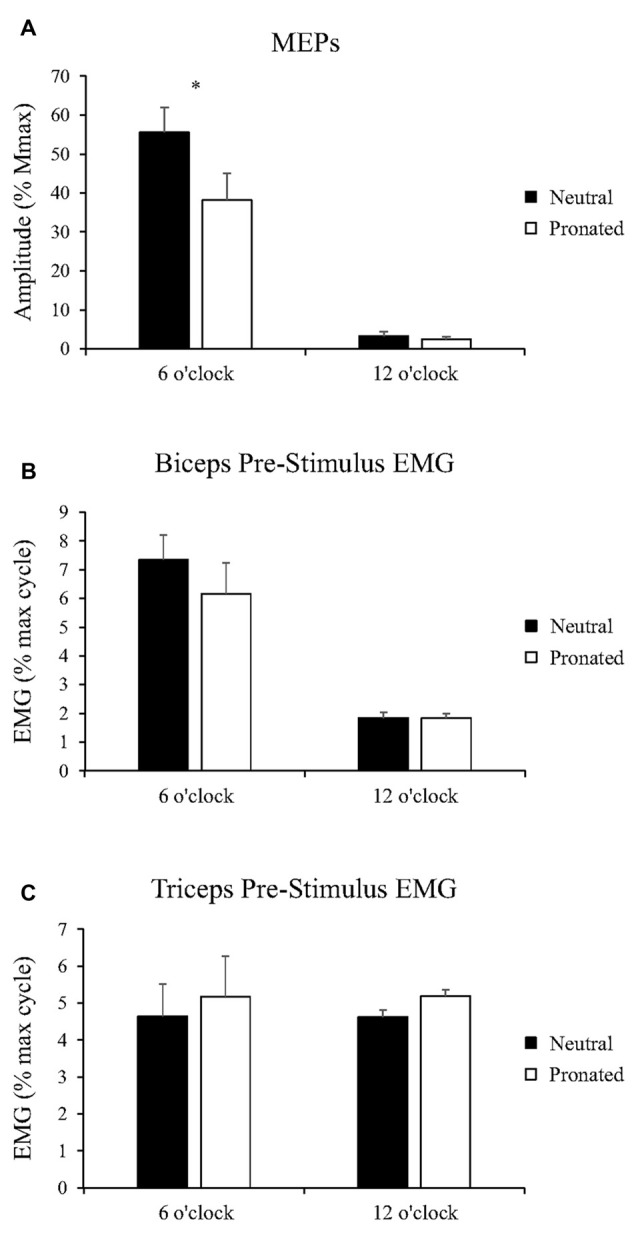
Figure 3.

Group data (mean ± SE, n = 10) during arm cycling for (A) MEP amplitudes of the biceps brachii, (B) biceps brachii pre-stimulus EMG prior to transcranial magnetic stimulation (TMS), and (C) triceps brachii pre-stimulus EMG prior to TMS. Black bars correspond to measures taken during arm cycling with a neutral handgrip while white bars correspond to a pronated handgrip. MEP amplitudes are shown relative to the Mmax taken during the same experimental condition. EMG is normalized to the maximum EMG found during the 10 s, maximal arm-cycling sprint. Asterisks denote a significant difference (P < 0.05) between the two handgrip positions.
