FIGURE 10.
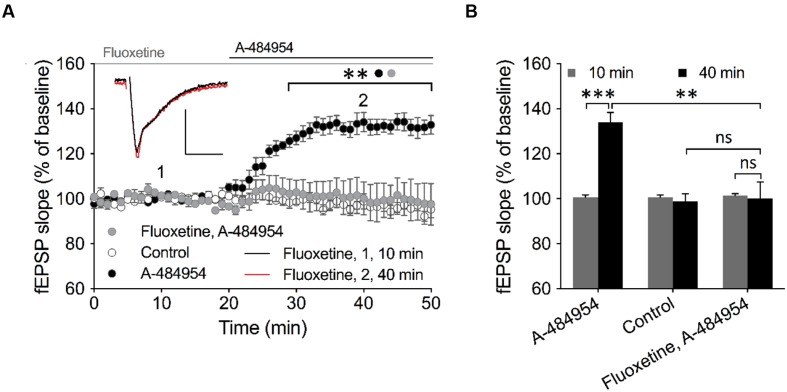
TREK-1 is involved in eEF2K-inhibition mediated fEPSP potentiation. (A) The graph outlines fEPSP-slopes over time under three experimental conditions (control: white circles, n = 4; 5 μM A-484954: black circles, n = 6; 100 μM Fluoxetine + 5 μM A-484954: gray circles, n = 6). The pretreatment and co-application of hippocampal slices with Fluoxetine and A-484954 significantly blocked A-484954 mediated fEPSP potentiation (p < 0.01). The resulting fEPSP slopes were similar in size as in the non-drug experiments (control: white circles). Horizontal black and gray lines indicate the A-484954 and Fluoxetine application period respectively. fEPSP traces for fluoxetine co-application experiments are shown. Scale bars: 0.5 mV/10 ms. (B) The bar graph summarizes averaged fEPSP-slope values for different experiments at the 10- and 40-min time points. Brackets enclose experimental groups with significant difference (∗∗p < 0.01, p = 0.0024; ∗∗∗p < 0.001, p = 0.0003).

