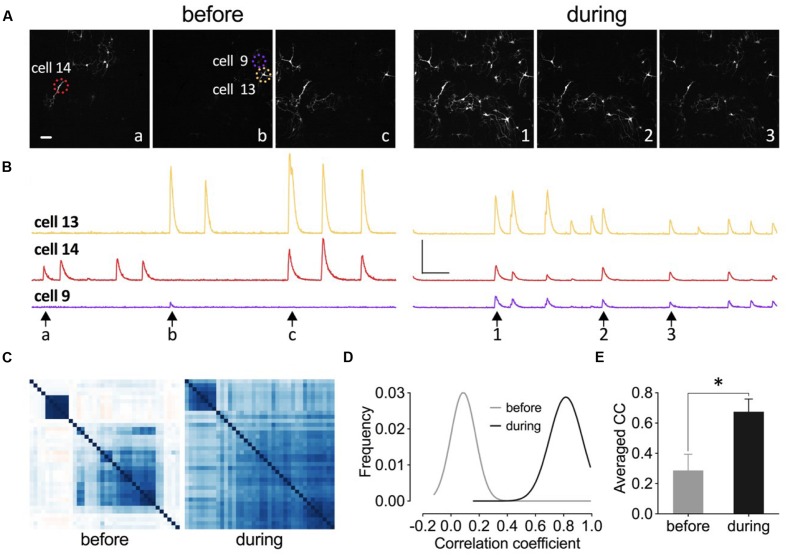
FIGURE 11.
Inhibition of eEF2K synchronizes neuronal activity pattern in primary hippocampal cell cultures. (A–C) Images, traces, and heat maps in the figure represent data from one representative experiment before and during drug application. (A) The time points for the representative frames of a fluorescence image sequence are indicated under the traces in (B) with arrows and letters or numbers. Dashed circles indicate representative neurons (14, 9, and 13). Scale bar, 100 μm. (B) The time courses of changes in fluorescence intensity for three neurons (color-coded throughout the figure) before and during drug application are presented. Vertical scale bar: 2000 (F-F0/F0) and horizontal bar: 5 s. (C) The degree of synchronized spike activity of neurons to each other are represented by a Pearson’s correlation based hierarchical clustering matrices. (D) Theoretical Gaussian fits for the frequency distribution histograms of Pearson’s correlation coefficients were created for all neuronal pairs of three cultures analyzed before and during drug application. (E) The bar graph summarizes the mean values of correlation coefficient (CC) matrices. The brackets and asterisks indicate the degree of significant difference (∗p < 0.05) of the coefficients before (0.29 ± 0.11) and after drug application (0.67 ± 0.08).

