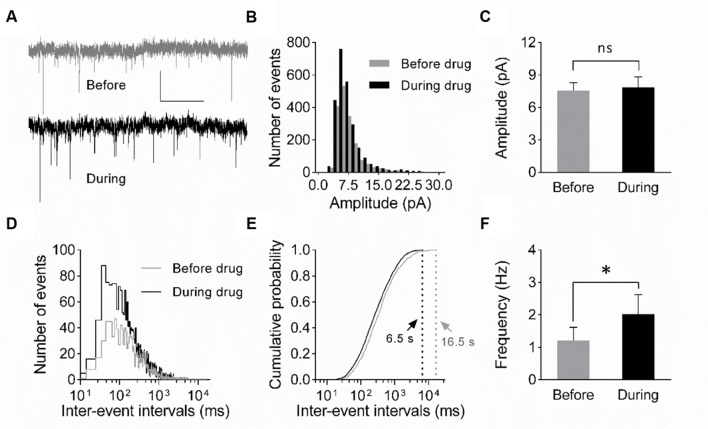
FIGURE 4.
Increase in mEPSC frequency suggests a presynaptic origin of eEF2K-inhibition mediated potentiation. (A) Representative traces of whole-cell voltage-clamp recordings of mEPSCs before (gray) and during (black) drug application are depicted. Scale bar: 10 pA/2 s. (B) The histogram summarizes the distribution of mEPSC amplitudes before (gray bars) and during (black bars) drug application over all events of all recordings (n = 7). (C) The mean amplitude before (gray bar) and during (black bar) drug application do not differ significantly (n = 7; 7.6 ± 0.7 pA versus 7.8 ± 1.0 pA; ns: p = 0.94). (D) The histogram indicates the distribution of the inter-event intervals for before (gray) and during (black) drug application for all events of all neurons analyzed (n = 7). (E) The cumulative probability of inter-event intervals of mEPSCs before (gray) and during (black) drug application differs. Vertical dashed lines indicate the maximal values of the inter-event intervals before (gray) and during (black) drug application. (F) The mean mEPSC frequencies differ significantly (∗p = 0.0148) before and during drug application (n = 7, 1.2 ± 0.4 Hz versus 2.0 ± 0.6 Hz).

