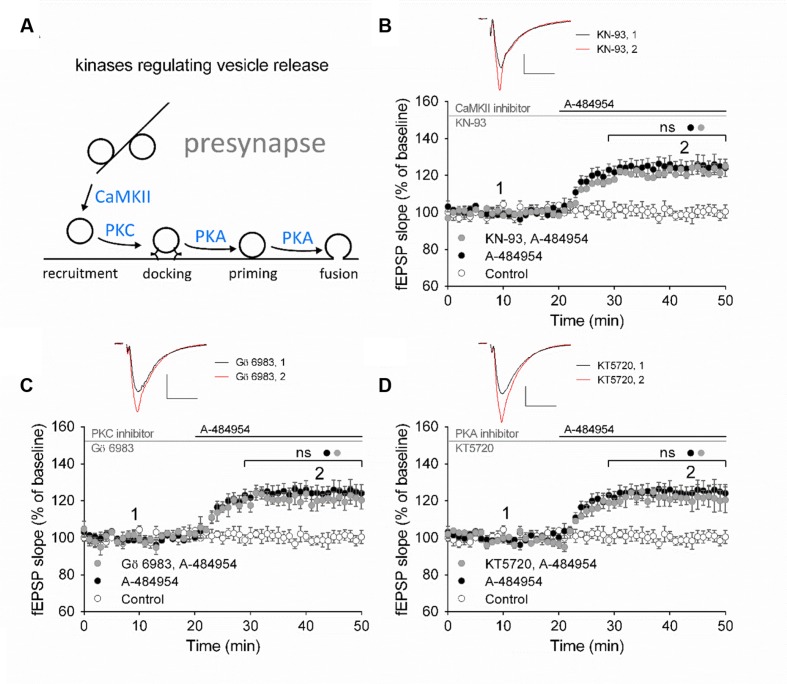
FIGURE 6.
eEF2K-inhibition mediated fEPSP-potentiation does not rely on CaMKII, PKC or PKA. (A) The schemata outlines the relation of kinases in the regulation of vesicle release. (B) Inhibition of CaMKII by KN-93 does not attenuate drug-induced potentiation (control: white circles = 6; 5 μM A-484954: black circles, n = 6; 20 μM KN-93: gray circles, n = 4). (C) The graph represents data of PKC inhibition experiments (gray circles: n = 4) in comparison to drug-free (control: white circles, n = 6) and A-484954 (black circles: n = 6) experiments. (D) Inhibition of PKA (KT5720: gray circles, n = 4) did not alter the time course of fEPSPs in comparison with experiments with the application of A-484954 alone (black circles, n = 6). The drug-induced potentiation remained significantly different from that in control experiments (white circles, n = 6). Black and gray horizontal lines represent the application period of A-484954 and inhibitors, respectively. Brackets enclose periods with significant differences (ns: p > 0.05) between groups as specified by the circles. fEPSP traces at time points 1 and 2 are depicted. Scale bars: 0.5 mV/10 ms.

