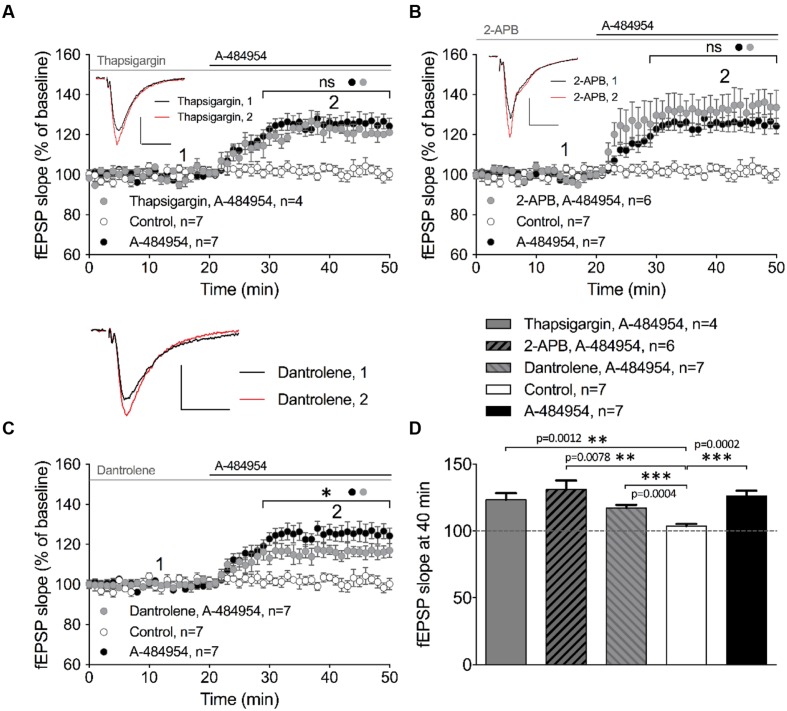
FIGURE 7.
eEF2K-inhibition mediated fEPSP-potentiation relies partially on intracellular calcium release. (A) Application of thapsigargin (10 μM thapsigargin: gray circles, n = 4) did not alter A-484954-induced fEPSP potentiation over time (drug-free: control, white circles, n = 7; 5 μM A-484954 alone; black circles, n = 7). (B) Inhibition of InsP3R-mediated intracellular calcium release (100 μM 2-APB: gray circles, n = 6) did not alter the slope of fEPSP potentiation (A-484954: black circles, n = 7), which remained significantly different from that in drug-free experiments (white circles, n = 7). (C) Inhibition of ryanodine receptors (20 μM dantrolene: gray circles, n = 7) significantly attenuated (p = 0.037) the potentiation of fEPSP mediated by eEF2K inhibition in comparison with A-484954 alone (black circles, n = 7). However, experiments with dantrolene gave significantly elevated results in comparison with drug-free measurements (control: white circles, n = 7). Black and gray lines indicate A-484954 and inhibitor application times, respectively. Brackets indicate significance levels (∗p < 0.05; ns: p > 0.05) between groups (circles). fEPSP traces for the time points 1 and 2 are depicted. Scale bars: 0.5 mV/10 ms. (D) The bar graph summarizes the observations and significance levels (brackets, ∗∗p < 0.01, ∗∗∗p < 0.001) for the different experimental conditions in comparison with drug-free (control) experiments for fEPSP slope values at the 40-min time point.

