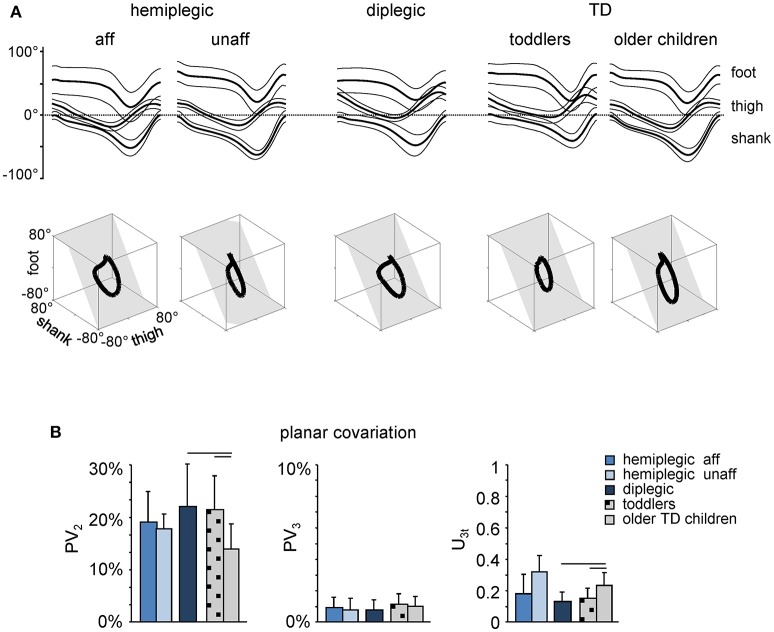
Figure 3.
Planar covariation of limb segment elevation angles during walking. (A) Ensemble-averaged (mean ± SD) foot, thigh and shank elevation angles plotted vs. normalized gait cycle. As the relative duration of stance varied across strides and subjects, a hatched region indicates an amount of variability in the stance phase duration. Examples of 3-dimensional gait loops and interpolation planes are shown on the bottom from left to right for one child with hemiplegia (9.9 years) and one diplegia (8.8 years), as well as for one toddler (1.1 year) and one TD child (6.2 years). Gait loops are obtained by plotting the thigh waveform vs. the shank and foot waveforms (after mean values subtraction). Gait cycle paths progress in time in the counter-clockwise direction, touch-down and toe-off phases corresponding roughly to the top and bottom of the loops, respectively. The interpolation planes result from orthogonal planar regression. (B) Percentage of total variation explained by 2nd and 3rd principal components (PV2 and PV3, respectively) and u3t parameter that characterizes the orientation of the normal to the plane are indicated for each group of children (mean ± SD). Horizontal lines denote significant differences with older TD children.

