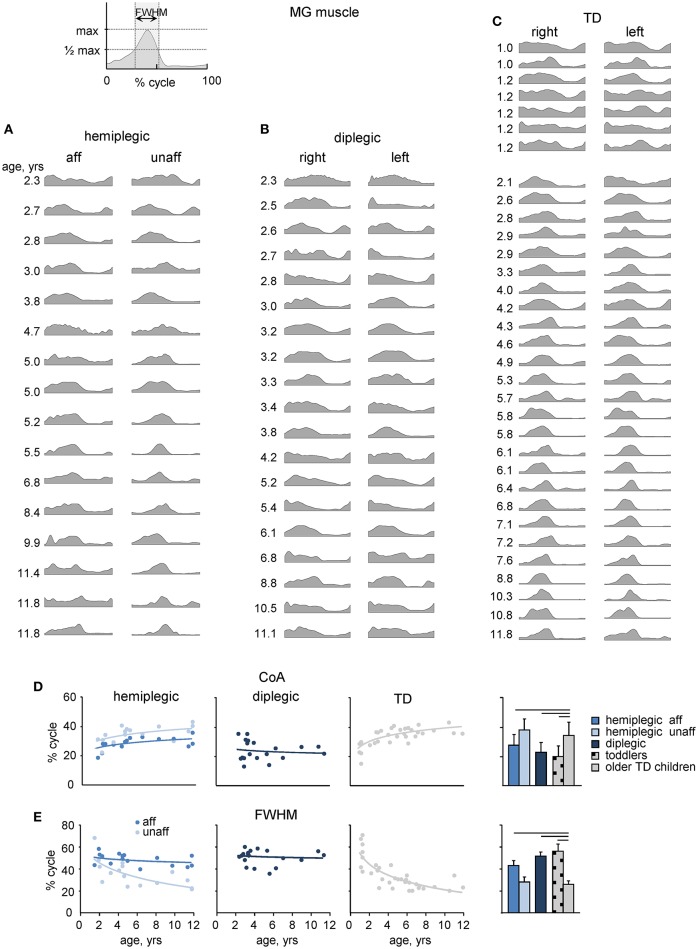
Figure 4.
MG muscle activity. (A–C) Stride-averaged MG muscle activity for each subject (ordered by age) in children with hemiplegia, diplegia and TD children, respectively. (D) Center of activity (CoA) of the MG muscle in individual subjects as a function of age (left panels) and averaged across children (right panel). Continuous lines on the left panels represent exponential fittings. (E), FWHM of MG activity as a function of age (left panels) and averaged across children (right panel). FWHM was calculated as the duration of the interval (in percent of gait cycle) in which EMG activity exceeded half of its maximum (see insert on the top). Horizontal lines denote significant differences compared with older TD children. Note a monotonic shift of the CoA toward later stance and a monotonic decrement of the FWHM in TD children with age, a lack of these changes in children with diplegia and their differential maturation on the affected and least affected sides in children with hemiplegia.

