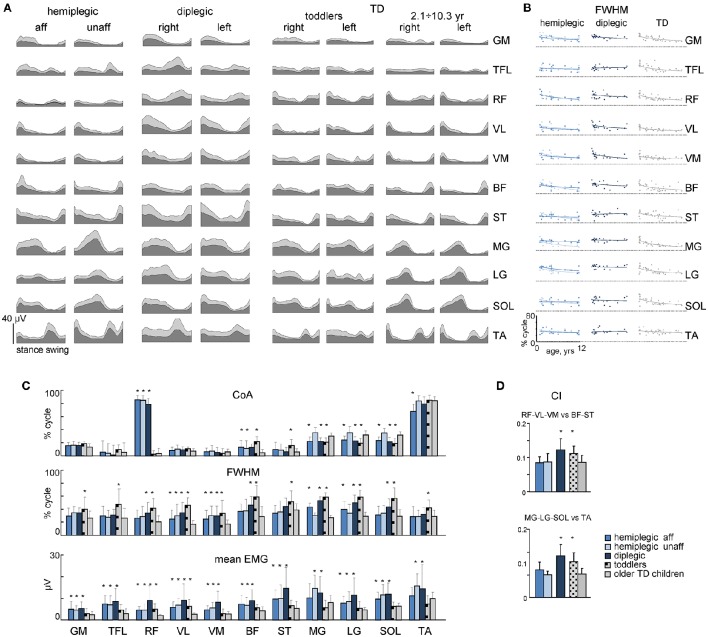
Figure 5.
Characteristics of EMG activity. (A) Ensemble averaged (mean + SD) EMG activity patterns of 22 bilateral leg muscles recorded in children with CP and TD children. EMG data are plotted vs. normalized gait cycle. (B) FWHM of EMGs as a function of age in children with hemiplegia, diplegia and TD children. Continuous lines represent exponential fittings. Note a monotonic decrement of FWHM in TD children. (C) CoA, FWHM and mean leg muscle EMGs (means + SD) for children with CP and TD children. (D) Co-activation index (CI) for RF-VL-VM vs. ST-BF and MG-LG-SOL vs. TA pairs of antagonist muscles. Asterisks denote significant differences with older TD children.

