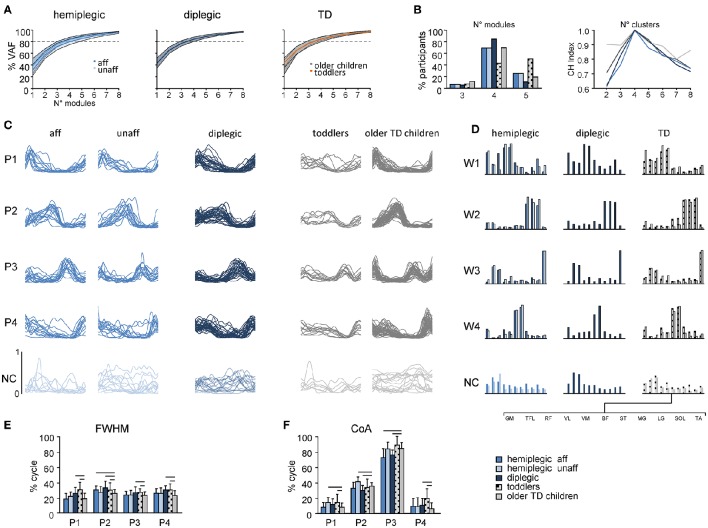
Figure 6.
Statistical analysis of EMG patterns using non-negative matrix factorization. The data for the most affected and less affected sides of children with hemiplegia and for TD toddlers and older children are shown separately. (A) Cumulative percent of variance (VAF) (±SD) explained by basic EMG components in hemiplegic (left), diplegic (center) and TD (right) children. (B) The number of modules needed to account for cycle-by-cycle variability of muscle activity estimated using the “best linear fit” method (left) and the normalized CH index (Caliñski and Harabasz, 1974) to evaluate the number of clusters in each group (right). Even if three to five modules were sufficiently representative in a few children, EMG activity in most children was well accounted for by four modules (>80% of VAF, A). (C) Comparison of muscle module (basic activation patterns) structures across different groups. Each curve represents the mean (across strides) pattern for an individual child. Common (across children) basic patterns were plotted in a “chronological” order (with respect to the timing of the main peak) and modules were ranked based on their best similarities (see Materials and Methods). Note that synergies with low structural consistency across children (NC, Not Classified) were plotted separately on the bottom in toned-down colors. (D) Group mean weights (synergies). (E,F) mean (+SD) FWHM and CoA of consistent basic activation patterns (P1–P4). Horizontal lines denote significant differences compared with older TD children. Note wider P2 and P4 patterns in children with CP and toddlers with respect to older children (E), consistent with wider EMGs (Figure 5C, bottom).

