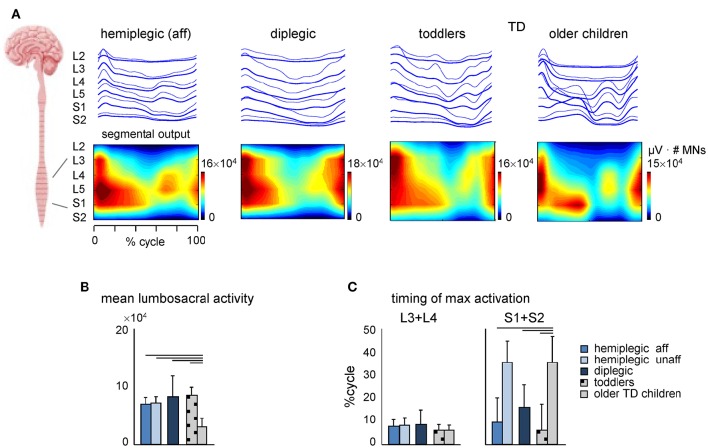
Figure 7.
Spatiotemporal maps of motoneuron activity of the lumbosacral enlargement in children with CP and TD children. (A) Output pattern of each segment is shown in the top panels (thick traces, means; thin traces, means + 1SD), while the same pattern is plotted in a color scale (using a filled contour plot) at the bottom. Motor output (averaged across children, reported in units of number of MNs) is plotted as a function of gait cycle and spinal segment level (L2 − S2). (B), Depicted are mean (+SD) activation of lumbosacral activity (averaged across both gait cycle and spinal level). (C) Timing of maximum activation of lumbar (L3 + L4) and sacral (S1 + S2) segments. The values represent the mean + SD. Lines over bars denote significant differences compared with older TD children.

