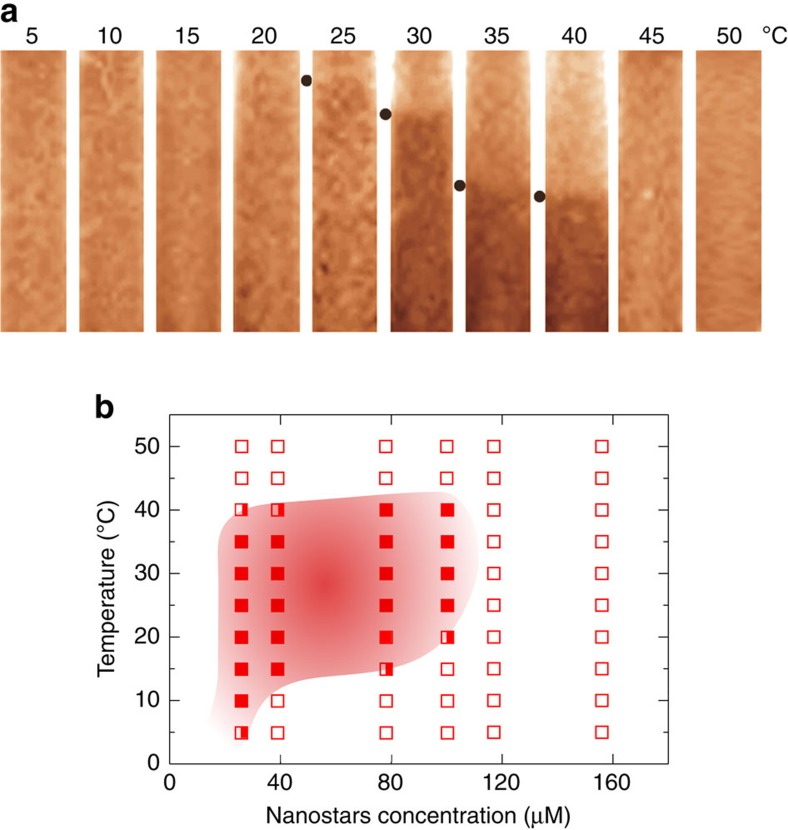
Figure 3. Phase diagram of the re-entrant DNA gel.
(a) Coloured photograph of the samples with c=100 μM at different T with the indication of the meniscus level (black points). The sample changes from homogeneous to phase separated to homogeneous again on cooling. Photographs of samples at different concentrations are reported in Supplementary Discussion Phase diagram. (b) Filled squares indicate phase separated state points, open squares indicate stable homogeneous solutions and semi-filled squares indicate borderline cases. The concentration is reported in μM of NSs (1 mg ml−1=14.2 μM). The red shadow area qualitatively indicates the region of phase separation.

