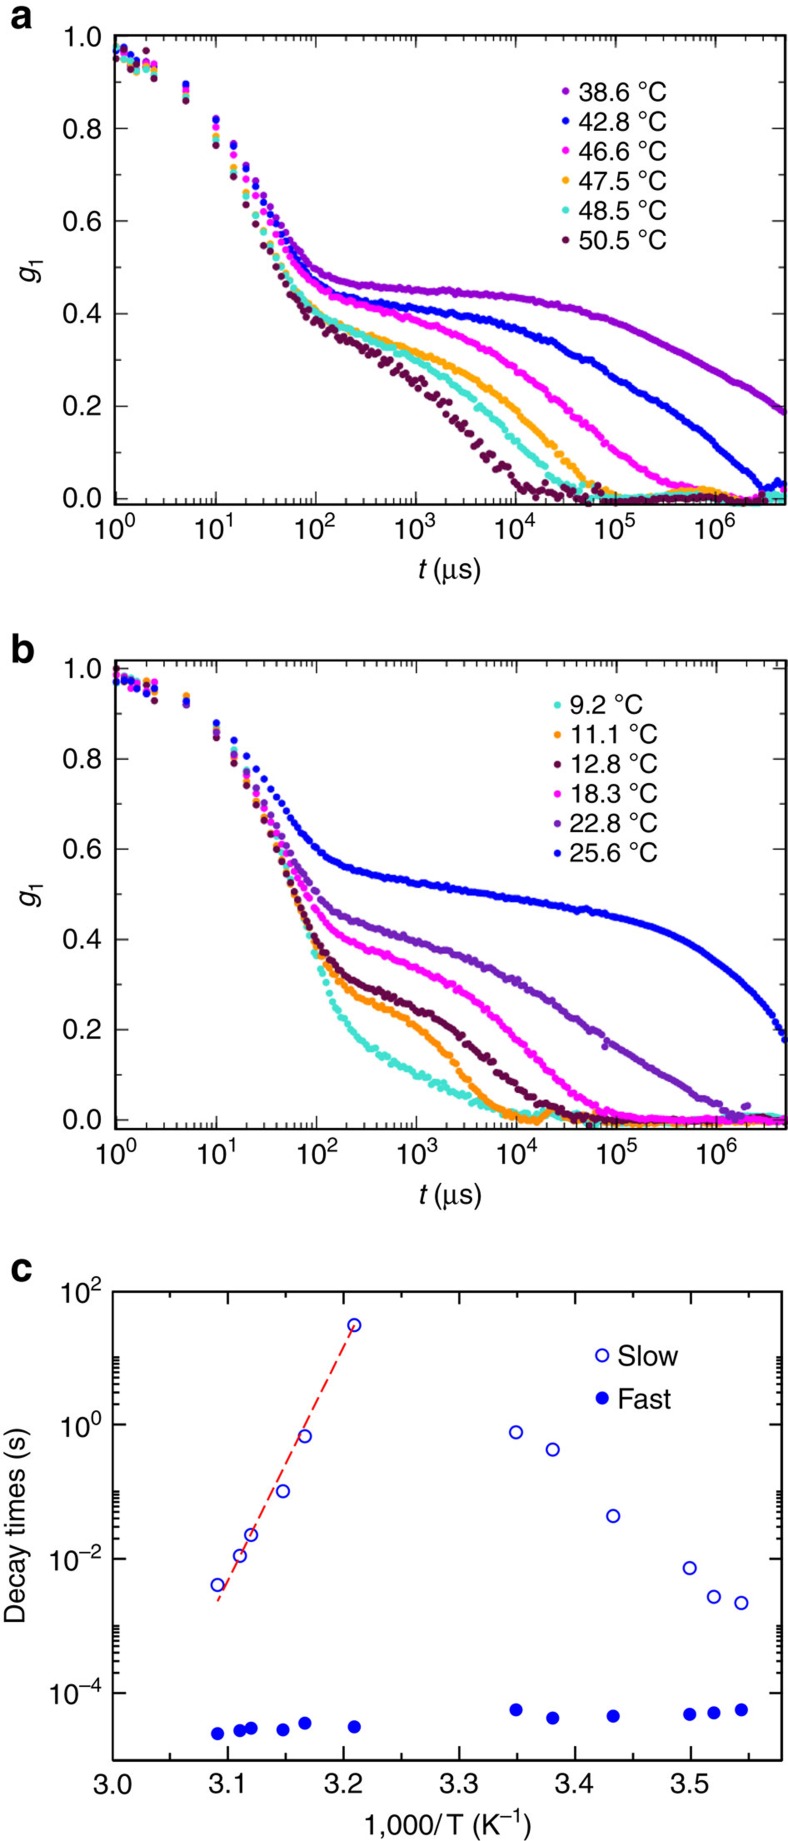
Figure 4. DLS correlation functions for different temperatures at c=213 μM.
(a) The region of gel formation where the decay time of the correlation functions progressively increases going beyond what can be experimentally measured (≈10 s) when T≈40 °C. (b) The region of gel breaking, where the decay time of the correlation functions progressively decreases, indicating the melting of the network and the formation of AB4 structures. (c) Temperature dependence of the average decay time as obtained by a stretched exponential fit of the slow decay as discussed in Supplementary Discussion Correlation function fit. The dashed red line is the best fitting curve of the slow decay characteristic time according to the Arrhenius law, with an activation energy of 160 kcal mol−1.

