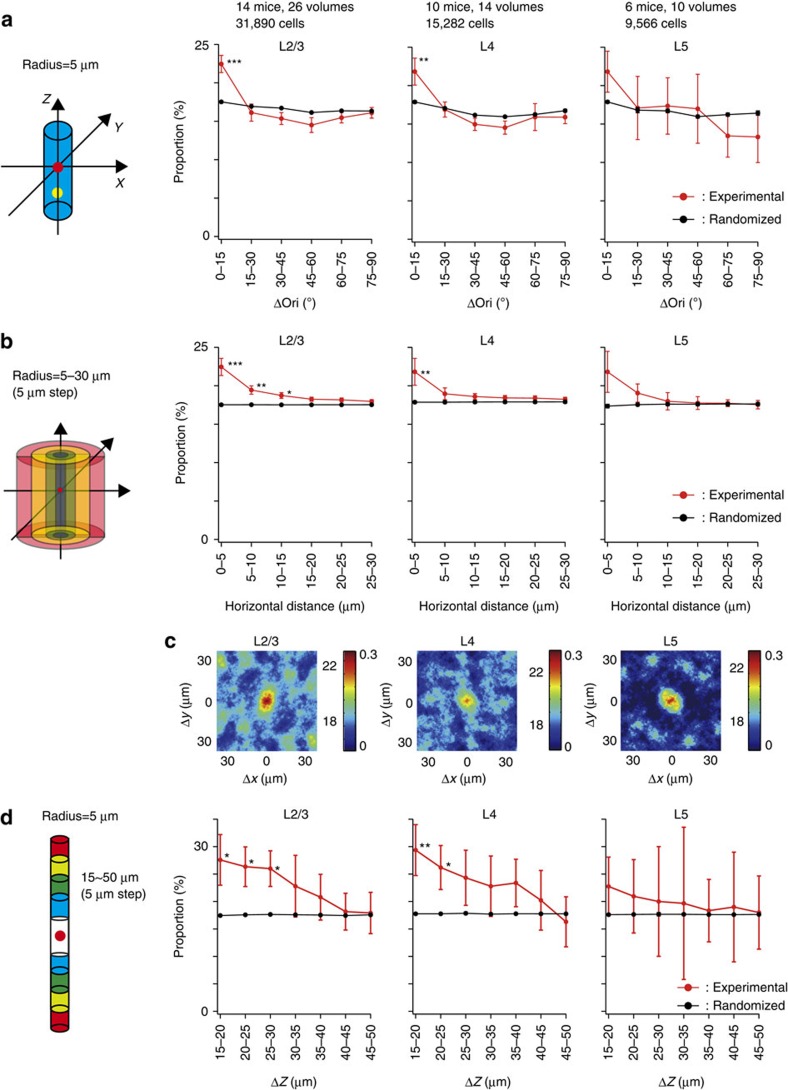
Figure 3. Proportion of neurons with similar orientation selectivity in a minicolumn.
(a) The proportion of neurons with similar orientation selectivity in a minicolumn (radius=5 μm). The proportion of cell pairs is plotted as a function of Δori between cell pairs . Significant differences are observed in the Δori=0–15° bin in layer 2/3 (P<0.001, n=26 volumes from 14 mice) and in layer 4 (P<0.01, n=14 volumes from 10 mice). Red: experimental data; black: randomized data. (b) Horizontal distribution of cell pairs with similar orientation selectivity. The Δori between pairs of orientation-selective cells located at 0–5, 5–10, 10–15, 15–20, 20–25 or at 25–30 μm from each other in the horizontal direction is calculated and the proportion of similarly tuned cell pairs (Δori<15°) is plotted as a function of horizontal distance. ***P<0.001, **P<0.01 and *P<0.05. The same analysis is performed for the randomized maps. Red: experimental data; black: randomized data. (c) The proportion map of similarly tuned cell pairs is plotted as a function of relative horizontal positions between cell pairs. The colour bar shows the proportion (left, %) and the SI (right). (d) Vertical distribution of similarly tuned cells. The Δori between cell pairs located within 5 μm in the horizontal direction and at 15–20, 20–25, 25–30, 30–35, 35–40, 40–45 or at 45–50 μm in the vertical direction is calculated and the proportion of similarly tuned pairs (Δori<15°) is plotted as a function of vertical distance. A significant difference is observed at 15–20, 20–25 and 25–30 μm in layer 2/3 (d left, n=26 volumes from 14 mice) and at 15–20, 20–25 μm in layer 4 (d middle, n=14 volumes from 10 mice). Red: experimental data; black: randomized data. **P<0.01, and *P<0.05.

