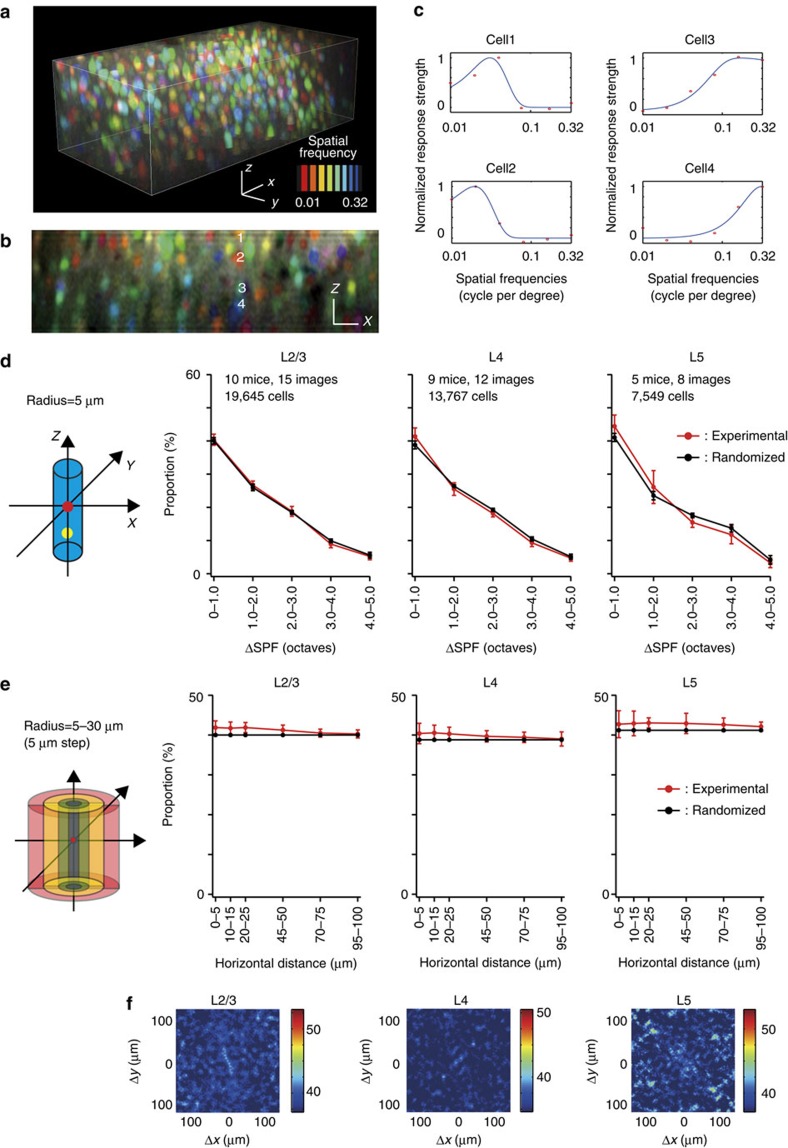
Figure 5. A 3D map of the SPF and the proportion of neurons with similar SPF tuning within a minicolumn.
(a) Three-dimensional SPF tuning map. Each colour represents a SPF, as indicated in the colour bar. Scale bars, 30 μm. (b) A x–z vertical section of the 3D SPF map in a. Scale bars, 30 μm. (c) SPF tuning curves of neurons 1–4 in b are fitted with the DOG function. (d) The proportion of cell pairs within a minicolumn as a function of logarithmic differences between the preferred SPFs (ΔSPF) of cell pairs, obtained from experimental (red line) and randomized maps (black line). (e) The proportion of similarly tuned pairs (ΔSPF<1 octave) of SPF-selective cells as a function of horizontal distances between the cell pairs for experimental (red line) and randomized maps (black line). (f) The proportion map of cell pairs with similarly preferred SPFs as a function of relative horizontal positions between cell pairs. The colour bar shows the proportion (%).

